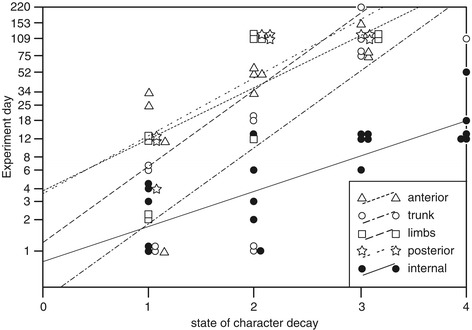
Figure 3.

Decay trajectory of characters grouped by body region. States of character decay coded as: 0 = pristine, 1 = onset of decay, 2 = complete decay, 3 = onset of loss, 4 = complete loss. Jaws and terminal claws are not shown, as they are pristine throughout the experiment. Lines are linear regressions.
