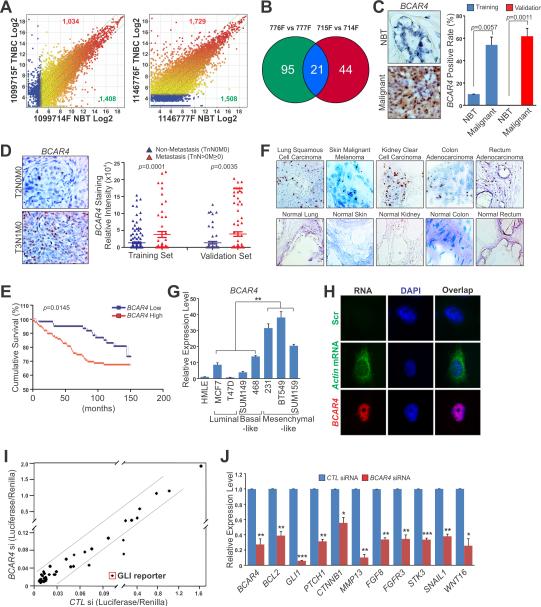
Figure 1. BCAR4 Correlates with Breast Cancer Metastasis.
(A) Scatter plots of lncRNAs significantly up-regulated (red) or down-regulated (green) in two pairs of TNBC tissues compared to the matched adjacent normal tissues (NBT). The X- and Y-axes: averaged normalized signal values (Log2 scaled); green lines: fold changes=4.
(B) Commonly up-regulated lncRNAs in two pairs of TNBC compared to NBT.
(C) RNAScope® detection of BCAR4 expression in human breast cancer and adjacent normal tissues. Left panel: representative images; Right panel: statistical analysis of training set (10 normal tissues vs. 222 cancer tissues) and validation set (10 normal tissues vs. 160 cancer tissues).
(D) RNAScope® detection of BCAR4 expression in Non-metastasis (TnN0M0) vs. Metastasis (TnN>0M≥0) breast cancer tissue. Left panel: representative images; Right panel: statistical analysis of training set (167 Non-metastasis vs. 55 Metastasis) and validation set (66 Non-metastasis vs. 94 Metastasis).
(E) Kaplan-Meier survival analysis of BCAR4 expression in breast cancer patients (n=160).
(F) RNAscope® detection of BCAR4 expression in multiple human tissues.
(G) RT-qPCR detection of BCAR4 expression in a panel of cell lines.
(H) Nuclear localization of BCAR4 detected by RNA FISH in MDA-MB-231 cells.
(I) Identification of signal pathways affected by BCAR4 knockdown in MDA-MB-231 cells. The X- and Y-axes: normalized ratio of firefly/Renilla luciferase activities.
(J) RT-qPCR detection of GLI-target genes expression. Error bars, S.E.M. of three independent experiments (*p<0.05, **p<0.01 and ***p<0.001).

