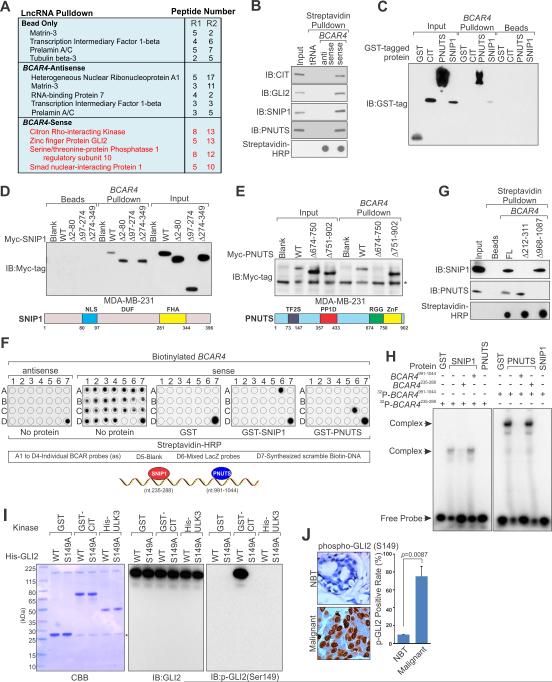
Figure 2. Identification and Biochemical Characterization of BCAR4-associated Proteins.
(A) A list of top BCAR4-associated proteins identified by RNA pulldown and MS analysis in MDA-MB-231 cells: R1 and R2 (biological repeat 1 and 2).
(B and C) Immunoblot (IB) detection of proteins retrieved by in vitro transcribed biotinylated BCAR4 from MDA-MB-231 cell lysates (B) and indicated recombinant proteins (C).
(D and E) IB detection of Myc-tagged SNIP1 (D) and PNUTS (E) (wt vs. domain truncation mutants) retrieved by in vitro transcribed biotinylated BCAR4. Lower panels: graphic illustration of the domain structure of SNIP1 (D) or PNUTS (E).
(F) In vitro RNA-protein binding followed by dot-blot assays. Bottom panel: schematic illustration of the BCAR4 sequence motifs that is recognized by SNIP1 and PNUTS, respectively.
(G) IB detection of proteins retrieved by in vitro transcribed biotinylated BCAR4 (wt vs. Δ212-311 and Δ968-1087) from MDA-MB-231 cell lysates.
(H) EMSA assay of recombinant SNIP1 and PNUTS binding to BCAR4 nt. 235-288 and nt. 991-1044 respectively.
(I) In vitro kinase assay showing CIT-mediated phosphorylation of GLI2 (wt vs. S149A). *: unspecific band.
(J) IHC staining of phospho-GLI2 (S149) in human breast cancer and adjacent normal tissues. Left panel: representative image. Right panel: statistics analysis based on (10 normal tissues vs. 222 cancer tissues).

