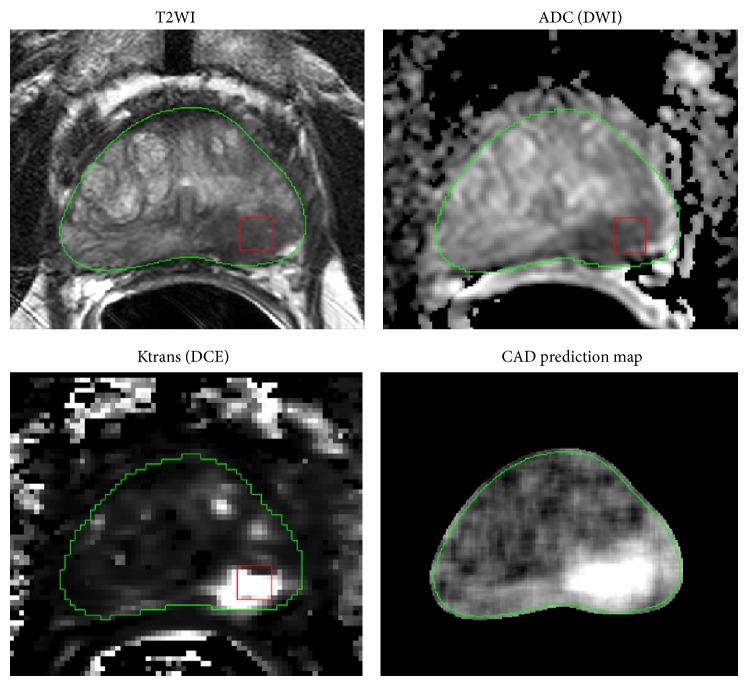
Figure 2.
Illustration of a prostate CAD prediction map showing true positive cancer classified correctly by SVM. The red rectangle indicates an image patch within the cancer in which local image features are extracted from T2WI, ADC, and Ktrans map. The green contour denotes the boundary of the prostate. Bright regions in the CAD prediction map correspond to a high probability of cancer and coincide with the correct location of the cancer.

