
Figure 4.
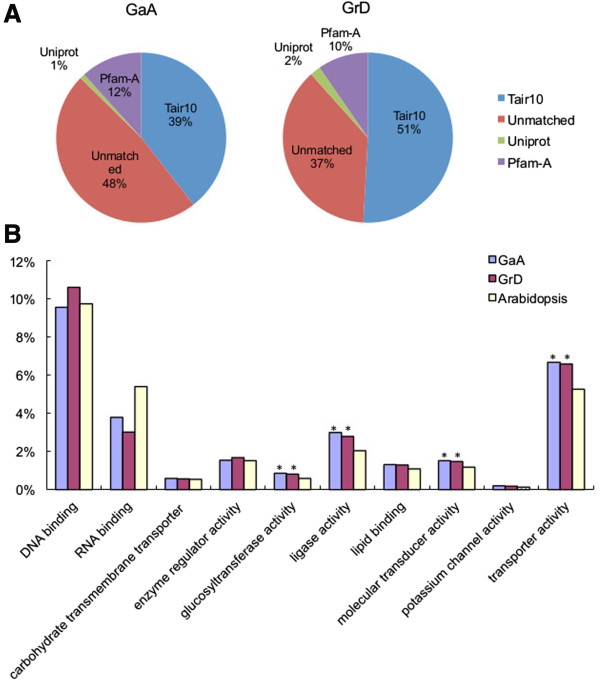
Analysis of homologous transcripts against protein and peptide databases. (A) Distribution of top BLASTX hits in GaA and GrD ESTs against known protein databases, TAIR10, Uniprot and Pfam-A, with a cut-off e-value of e-10. (B) Gene Ontology (GO) analysis using categories of molecular functions (* indicates GO categories that were enriched at the statistical significant level, p <0.05).