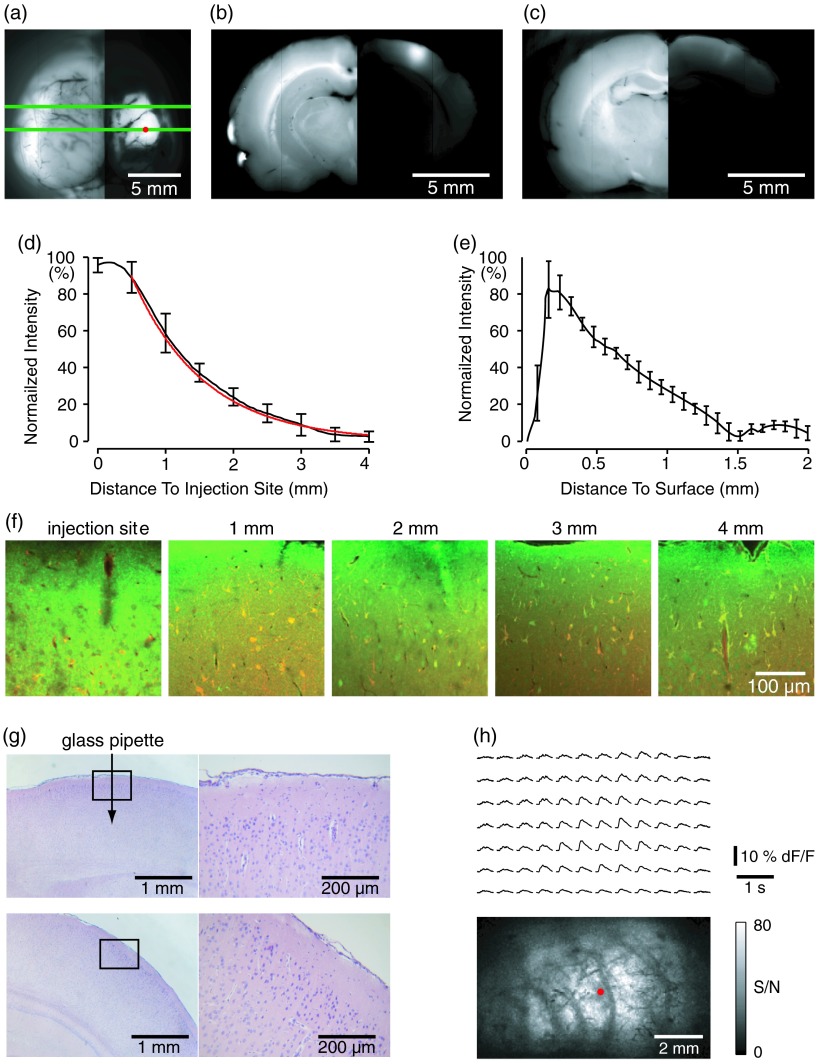
Fig. 2.
Distribution of calcium dye in the cortex. (a) CED loading with Oregon Green 488 BAPTA-1 AM (OGB-1 AM) injected into one hemisphere (red dot, right panel) creates continuous loading up to the edge of the craniotomy. The entire left hemisphere is shown on the left (530-nm illumination) for spatial comparison. Two green lines indicate the locations of the coronal slice shown in (b) and (c). (b) Note that although the calcium fluorescence is higher immediately around the injection site, there is widespread staining up to away in all directions. (c) In a coronal slice away from the injection site, a 5- to 6-mm area of cortex remains stained in a homogeneous fashion. Also note that staining is continuous from layers 1 to 6 with abrupt cessation at the pial surface and ependyma of the ventricle where resistance is met. (d) The average horizontal distribution of calcium fluorescence in the cortex ( rats). The red line shows an exponential decay fitting of the fluorescence curve. (e) The averaged vertical distribution of calcium fluorescence in the cortex ( rats). (f) Confocal images taken from a coronal slice crossing the injection site. The images were taken at different distances from the injection site. Each image shows the fluorescence from the superficial 300 μm of cortex. The green fluorescence from OGB-1 is overlaid with the red fluorescence from sulforhodamine 101. The neurons are shown in green cell and the astrocytes are orange. The majority of superficial fluorescence comes from the neuropil. However, in the deeper layers, both neurons and glia are equally stained. (g) Standard H&E staining of a coronal slice from the injection site—top: the injection site and bottom: 3 to 6 mm away from the injection site. The black box in the left images indicates the area zoomed-in on the right. (h) An interictal spike induced with topical bath application of 1 mM BMI—top: the spatial distribution of calcium waveform during an interictal spike and bottom: the signal-to-noise ratio of each pixel during the ictal event. The red dot indicates the OGB-1 injection site.

