
Fig. 3.
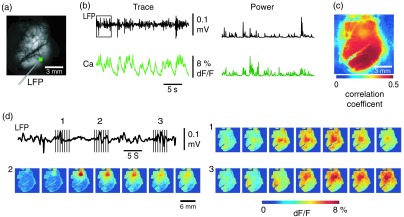
Wide-field calcium imaging of spontaneous activity. (a) The field of view of the calcium imaging. A small green square adjacent to the tip of the local field potential (LFP) electrode on the calcium image indicates a region of interest (ROI) from which the calcium trace is derived. Note that the surrounding bone is not visible as the signal is too attenuated. (b) The simultaneously recorded LFP and calcium traces from two ROIs. The green ROI was adjacent to the LFP electrode and the blue ROI was taken from the adjacent bone. The left shows the raw LFP and calcium signals and the right shows the power of the signals. A black box over the LFP indicates the section zoomed in (d). Note that LFP clearly correlates with the faster activity in the calcium tracing. (c) The pseudo-color image of correlation coefficient between the power traces of LFP and calcium signal from each pixel. A high correlation is seen over the entire calcium labeled cortex whereas there is low correlation from the surrounding bone, indicating that the calcium signal effectively demonstrates synaptic activity throughout the cortex. (d) The spatial propagation of the calcium signal during three spontaneous spikes. Vertical bars over the LFP indicate the time points for the calcium images. Interframe interval: 36 ms. Note that the propagation patterns are different for each LFP event, each of which has its own morphology.