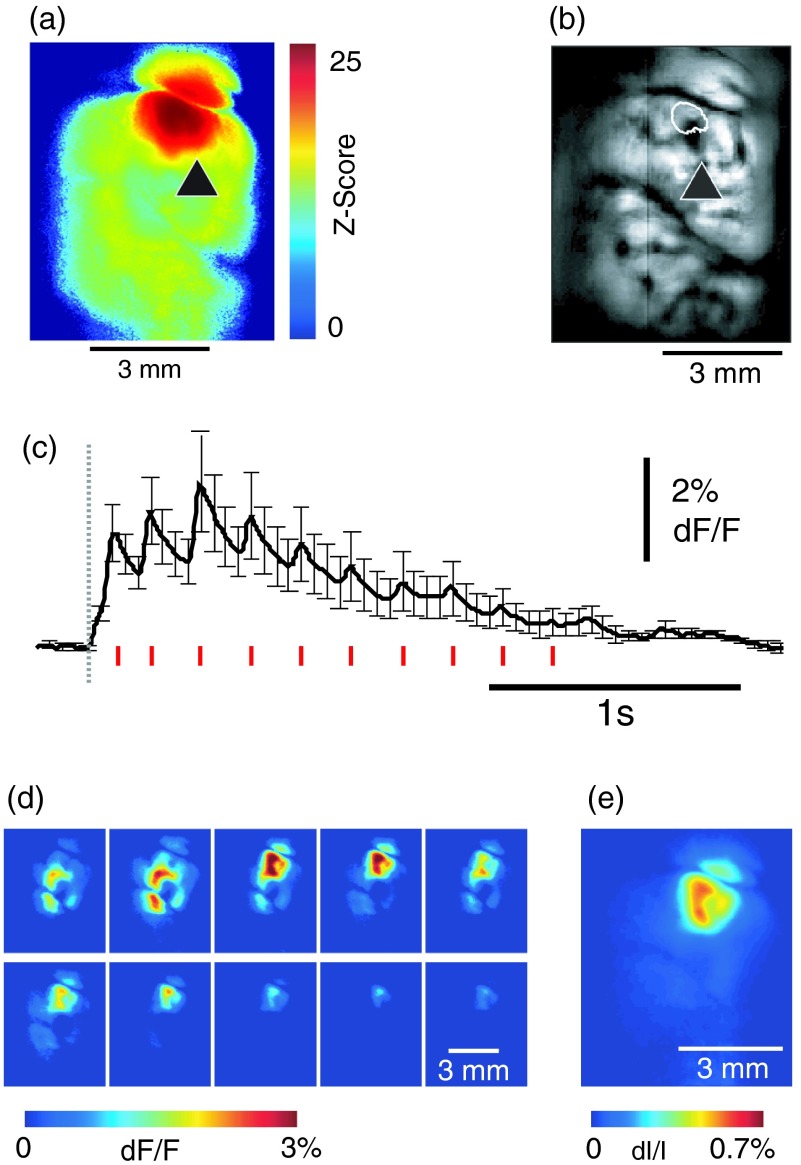
Fig. 4.
Calcium imaging of somatosensory responses to hind-paw stimulation. (a) Statistical parametric map (SPM) of cortical calcium responses to 2 s hind-paw stimulation in a representative animal (hot colors denote large z-scores associated with robust increases in calcium signal). (b) Digital image of the cortical surface in the same animal as (a) coregistered with SPM-derived ROI (defined as pixels with of maximum z-score, perimeter as white dashed line). Black triangle in (a) and (b) indicates location of single calcium dye injection in this animal. (c) Averaged calcium signal time-series () from SPM-derived ROIs, showing robust increases in response amplitude to stimulation and subsequent adaptation (as percentage change from baseline). Gray dashed line indicates stimulation onset. Error bars are SEM. Ten red bars indicate the time of the peak response to the stimulation and the images are shown in (d). (d) The spatial distribution of the stimulation-induced activity. Note that the first two stimuli induce activity in a broader area than later stimuli. (e) The spatial distribution of 530-nm intrinsic optical signal. The image is an average of the recording 5 to 7 s post the stimulation. The intrinsic signal showed similar spatial distribution as the SPM map.

