Fig. 5.
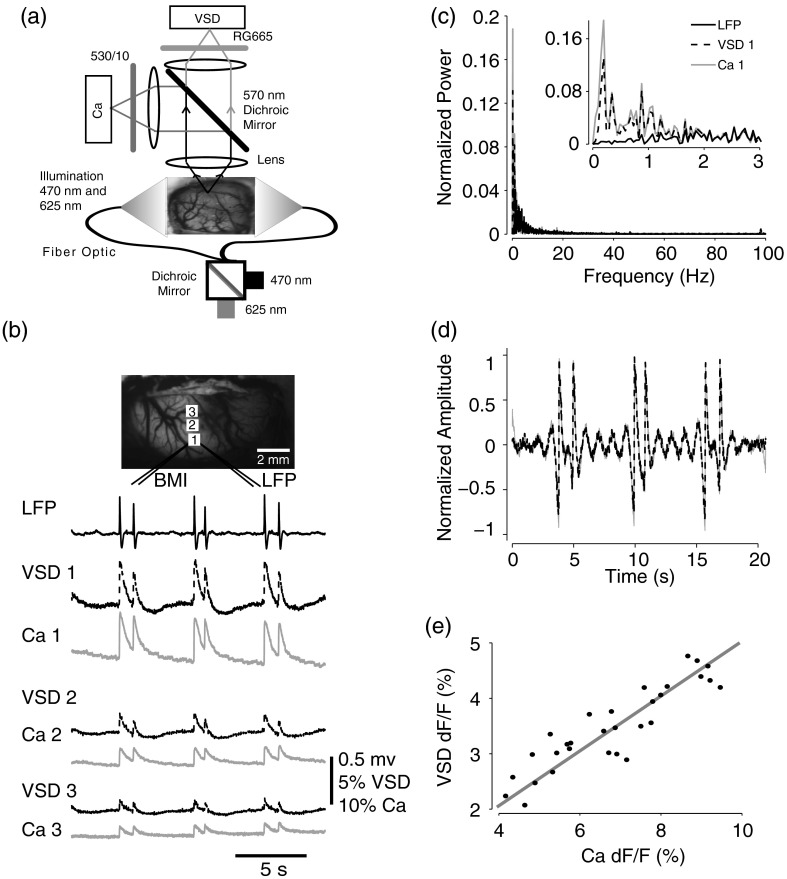
Simultaneous calcium and VSD imaging of an interictal event. (a) Experimental setup for simultaneous VSD and calcium imaging. Two light-emitting diodes (LEDs), and , coupled with a dichroic mirror are employed as illumination sources. The illumination is guided with fiber optics onto the cortex. The fluorescence of OGB-1 AM and RH-1691 are collected with a camera lens and separated with a 570-nm dichroic mirror. A filter is placed in front of the calcium imaging camera and a 665-nm long-pass filter (RG-665) is placed in front of the VSD camera. (b) The field of view imaged with VSD and calcium imaging. Three small white boxes on the image indicate the ROIs in which the VSD and calcium tracings were derived. The simultaneously recorded LFP, VSD, and calcium traces from the ROIs are shown at the bottom. (c) The frequency distributions of LFP, VSD, and calcium signal. The inner panel is a magnification of the low-frequency section. Note that the frequency distributions are largely overlapping and the VSD and calcium signals show highest power in the low-frequency range (0 to 1 Hz), while LFP correlates more strongly in the higher-frequency range. (d) The normalized 1-Hz high-pass filter (first-order Butterworth filter) of the VSD and calcium trace. Note that the VSD and calcium traces are almost identical. (e) Plot of the VSD fluorescence changes versus calcium fluorescence changes. Each dot indicates the peak amplitude of an interictal spike recorded by both imaging methods. A linear fit of the amplitudes was extrapolated.

