
Fig. 6.
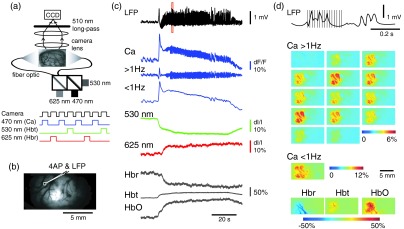
Simultaneous calcium and multiwavelength intrinsic optical signal (IOS) of an ictal event. (a) Diagram of the setup for simultaneous calcium-sensitive dye and IOS imaging. 470-, 530, and 625-nm LEDs are coupled with dichroic mirror to serve as an illumination source. These LEDs are set to be alternately triggered by the camera frame indicator to capture calcium images at 55 Hz and IOS at 27.5 Hz. A 510-nm long-pass filter is placed before the camera to filter out the calcium illumination (470 nm). (b) The field of view of the imaged cortex. A small box indicates an ROI, in which the calcium and intrinsic optical imaging traces are derived. The left box is located adjacent to the 4-AP/LFP electrode, which is the source of the epileptic focus. (c) The waveforms of different recording modalities during an ictal event derived from the ROI shown in (b). A red box over the LFP indicates a section zoomed in (d). Note that the calcium trace has two components: the high-frequency component () is closely related with LFP, but the low-frequency component () does not reflect the dynamics of the LFP. (d) The spatiotemporal distribution of the high- and low-frequency calcium signals as well as the hemodynamic components. The vertical bars overlapping the LFP indicate the timing for the calcium imaging frames. Frame interval: 18 ms. The spatial distributions of low-frequency calcium signals and each of the hemodynamic signals are shown at the bottom.