Figure 2.

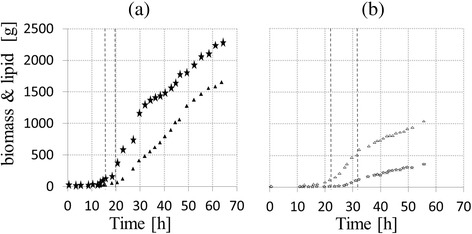
Evolution versus time of cell (stars) and lipid (triangles) masses [g] for (a) culture with instantaneous stop of nitrogen flow (b) culture with sigmoid decrease of nitrogen flow.

Evolution versus time of cell (stars) and lipid (triangles) masses [g] for (a) culture with instantaneous stop of nitrogen flow (b) culture with sigmoid decrease of nitrogen flow.