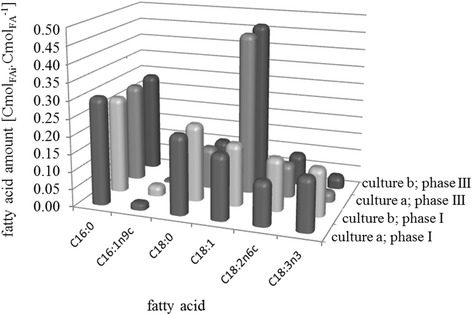
Figure 4.

Average fatty acid profiles of intracellular lipids during culture (a) and (b). In the front of the panel: average fatty acid profiles during exponential growth (phase I) of fed-batch culture of R. glutinis at 30°C with sudden nitrogen limitation (culture (a)) and progressive limitation (culture (b)) . In the rear of the panel: average fatty acid profiles during nitrogen limitation (phase III) of fed-batch culture of R. glutinis at 30°C with sudden nitrogen limitation (culture (a)) and progressive limitation (culture (b)).
