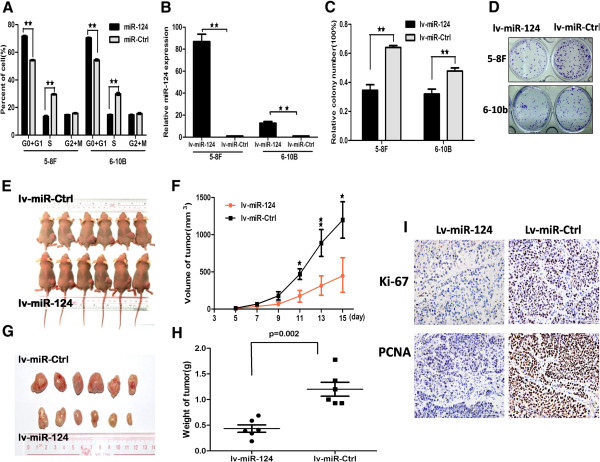
Figure 3.

The ectopic of miR-124 affected cell cycle in the NPC cell lines in vitro and suppressed cell growth in vivo. A, The ectopic expression of miR-124 arrest G0 + G1 phases and decreased S phase in 5-8 F and 6-10b compared with miR-Ctrl. B, Stably expression of miR-124 cell lines were evaluated using real time qPCR. C, Colonies were evaluated and values were reported as the ratio between lv-miR-124-infected cells and lv-miR-Ctrl infected cells. D, Pictures of colony formation assay of lv-miR-124 infected 5-8 F and 6-10b cell lines. (E and F), 5-8 F cells infected lv-miR-124 and lv-miR-Ctrl were injected subcutaneously into nude mice, at 15 days after implanted, lv-miR-124 infected 5-8 F cells produced smaller tumors than control cells. The “F” figure showed the growth curve of tumors volumes. Each data point represents of 6 mice. G, Picture showed the tumors after stripped. H, The weight of tumors compared with 5-8 F infected lv-miR-124 and lv-miR-Ctrl. I, Ki-67- and PCNA-stained sections of transplanted tumors formed after orthotopic transplantation. Scale bars, 100 μm. Statistical analysis was performed using the nonparametric tests. *, P < 0.05, **, P < 0.01.
