Figure 7.

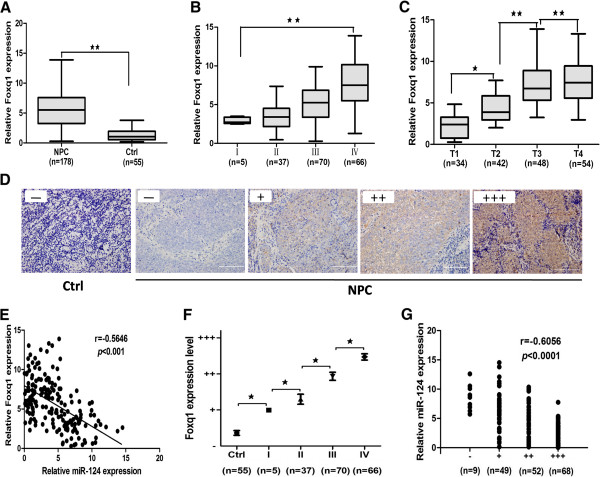
Mir-124 and Foxq1 are inversely correlated in NPC tissues. A, The average expression level of Foxq1 in human NPC specimens compared with non-cancer biopsy samples. B, The Foxq1 expression of clinicalIstage had lower expression than in the IVstage. C, Foxq1 expression was lower in stage T1, whereas stages T2-T4 had higher levels. D, Representative IHC for Foxq1 in non-cancer biopsy samples and NPC specimen with different clinical stages. E, In the mRNA levels, a significant inverse correlation was observed after correlated Foxq1 with the miR-124 expression levels in the 178 NPC specimens. F, Statistical quantification of the IHC scores of Foxq1 between non-cancer biopsy samples and NPC specimen with different clinical stages. Scale bars, 100 μm. G, A scatter diagram shows an inverse correlation between miR-124 and Foxq1 expression in the same set of NPC tissue (Spearman’s correlation analysis, r = -0.6056; p < 0.0001).Statistical analysis was performed using the nonparametric tests (A) and the one-way ANOVA (B, C, E, F). *, P < 0.05, **, P < 0.01.
