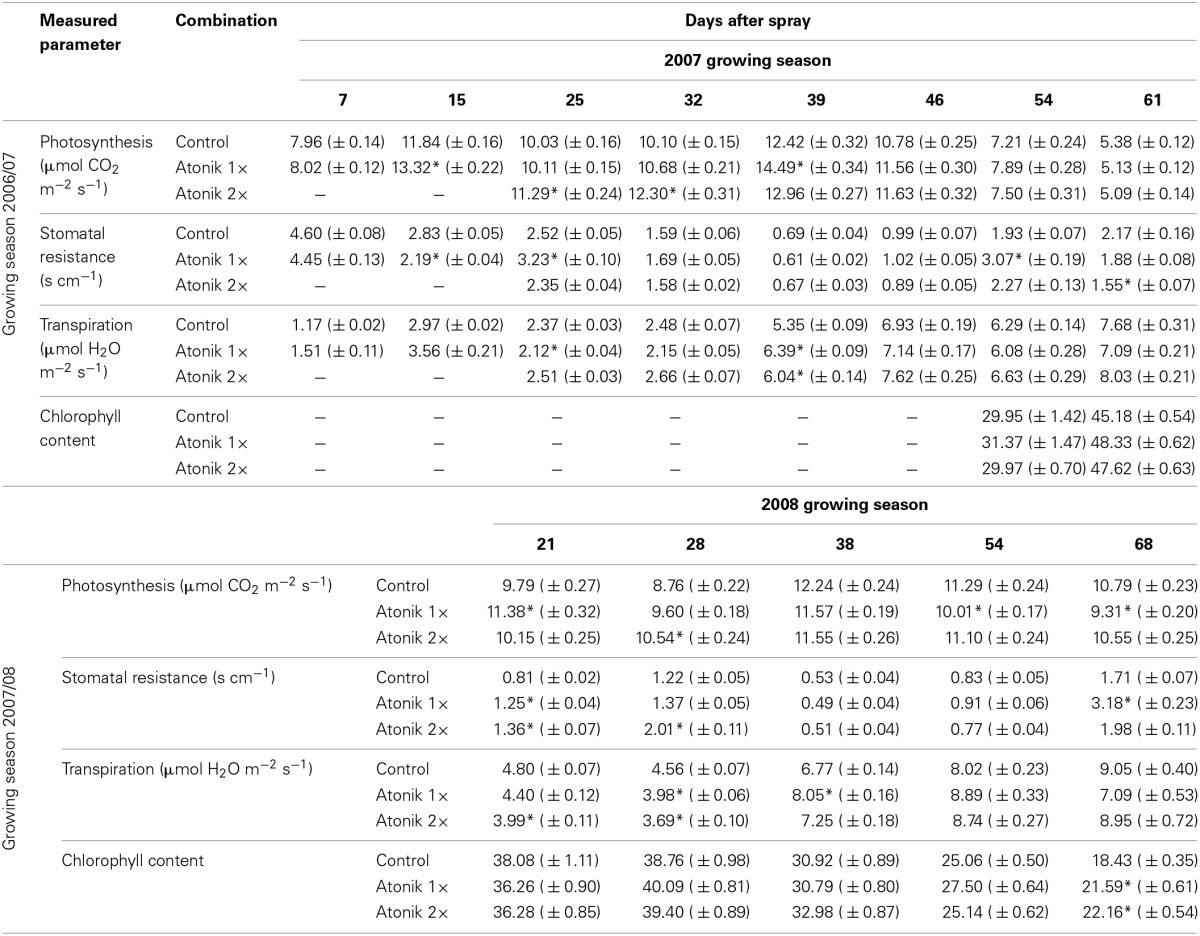
Table 3.
Effect of Atonik on the intensity of photosynthesis and transpiration, stomatal conductance, transpiration and chlorophyll content in oilseed rape plants.

Presented data are Mean ± SE, n = 24 or 36 (chlorophyll content).
*Values differ significantly at α = 0.05 as determined by LSD of t-Student test.
