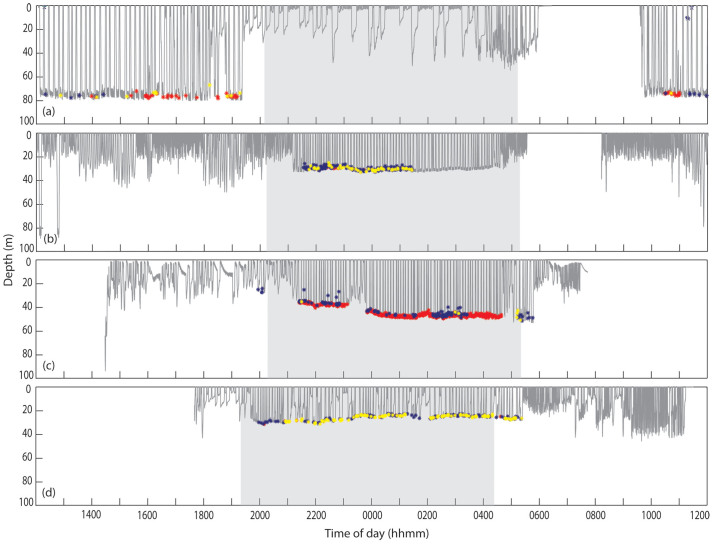
Figure 4. Dive profiles from four tagged individuals.
Asterisks mark the detection of paired bursts. Red = focal-associated (SNR > 20 dB), Yellow = non-focal (15 dB < SNR < 20 dB), Blue = non-focal (SNR < 15 dB). All records were aligned to allow for direct comparison of time of day. Night hours are indicated by grey shading in each plot. (a) July 2004 mn04_189b, ‘Parens'; (b): July 2006 mn06_192a; ‘Division' (c): July 2008 mn08_189a; ‘Falcon'; (d):April 2009 mn09_108a; ‘Division'.

