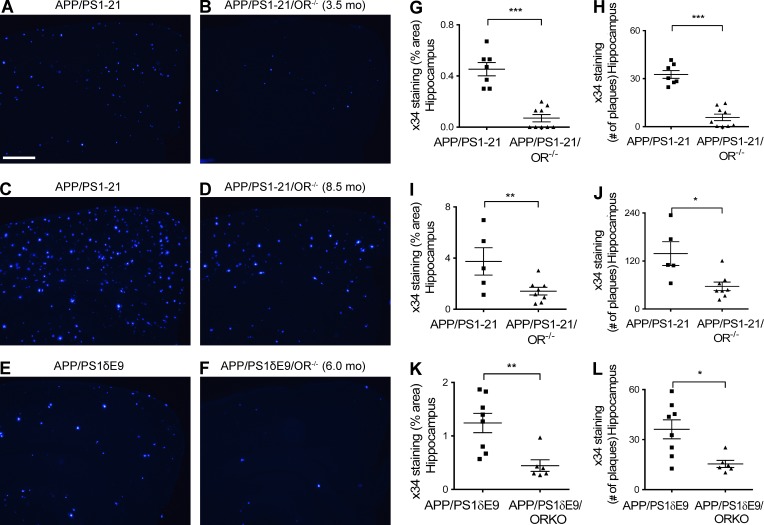
Figure 2.
Marked reduction of amyloid pathology in the APP/PS1/OR−/− mice compared with APP/PS1 mice. (A–L) Amyloid pathology measured by Aβ immunoreactivity and number of amyloid plaques after X-34 staining is noted at 3.5 (A, B, G, and H) and 8.5 mo (C, D, I, and J) in the APP/PS1-21 mouse line and at 6 mo in the APP/PS1δE9 mouse line (E, F, K, and L). Each mouse was investigated independently one time. Data are presented as mean ± SEM (n = 5–9 in each group, two-tailed Student’s t test). *, P < 0.05; **, P < 0.01; and ***, P < 0.001. Bar, 100 µm.

