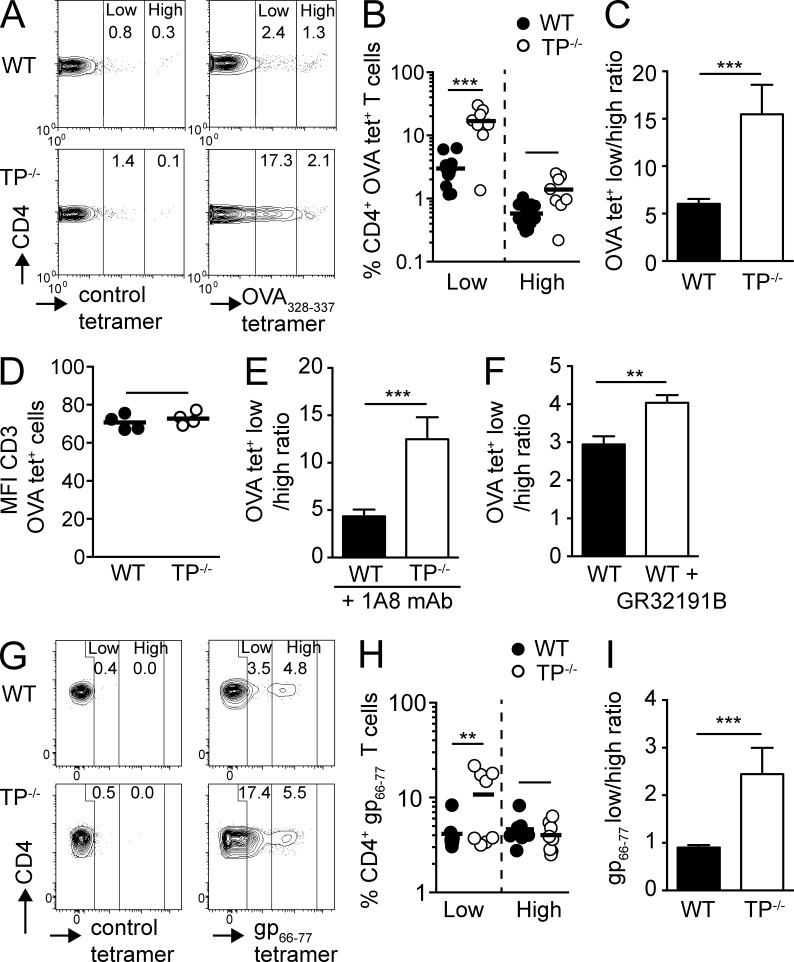
Figure 1.
Absent TP signaling results in enhanced expansion of low-avidity CD4+ T cells during inflammation. (A–D) WT and TP−/− mice were immunized with OVA/CFA, and OVA-specific CD4+ T cells in the draining peripheral LNs (PLNs) were analyzed on day 8 by tetramer staining. (A) Representative flow cytometry plots of polyclonal WT versus TP−/− CD4+ T cells after gating on CD4+ T cells and staining with control or OVA-specific tetramers. Numbers indicate percentage of CD4+ T cells in low and high tet+ gates. (B) Percentages of low and high OVA tet+ CD4+ T cells. (C) Ratio of low versus high OVA tet+ CD4+ T cells. (D) MFI of CD3 expression on OVA tet+ WT and TP−/− T cells. (E and F) Mice were immunized as in A–D. Neutrophils were depleted by injecting anti-Ly6G antibody (1A8) on day −1 (E) or mice were treated with a selective thromboxane receptor antagonist (GR32191B) for 9 d starting 1 d before immunization (F). Ratio of low versus high OVA tet+ CD4+ T cells in draining PLNs at day 8 are shown. (G–I) WT and TP−/− were infected with LCMV Armstrong, and CD4+ T cells in spleen were analyzed on day 8. (G) Representative flow cytometry plots of control and gp66-77 tet+ CD4+ T cells. Numbers indicate percentage of 7AAD− CD4+ T cells in low and high tet+ gates. (H) Percentages of low versus high gp66-77 tet+ CD4+ T cells. (I) Ratio of low versus high gp66-77 tet+ CD4+ T cells. Data in B, C, and E are pooled from two independent experiments with a total of 4–7 mice per condition and combined staining of each sample with two different OVA tetramers, whereas D and F show representative data from one of two independent experiments with comparable results (3–4 mice/group). Data in G–I are pooled from two independent experiments with a total of 8 mice/group. Data in B and H were analyzed using ANOVA with Sidak’s post-test, whereas C–F and I were analyzed using the Mann-Whitney test and are shown ±SEM. **, P < 0.01; ***, P < 0.001.

