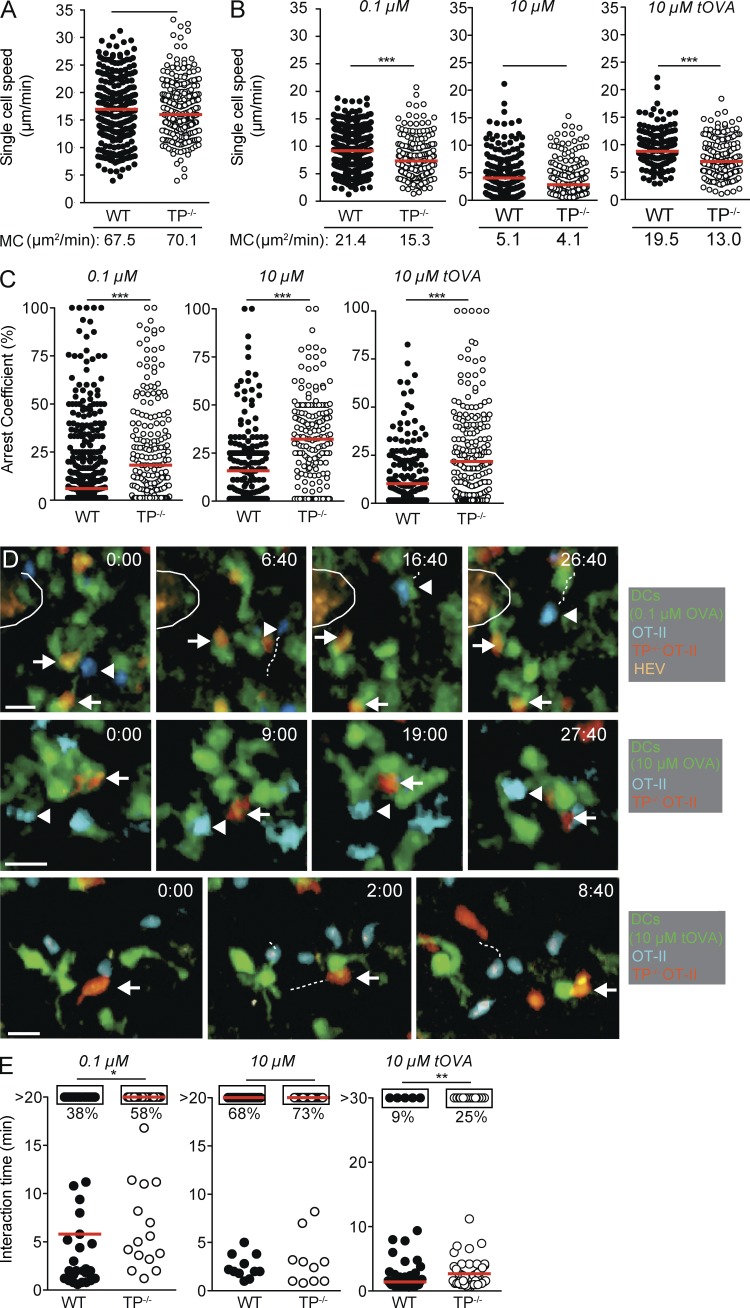
Figure 2.
Intravital imaging of WT versus TP−/− OT-II CD4+ T cell interactions with pMHC-loaded DCs. (A–E) Polyclonal WT and TP−/− T cells were adoptively transferred in the absence of s.c. injected DCs (A) or WT and TP−/− OT-II CD4+ T cells were transferred in presence of DCs pulsed with indicated OVA323-339 or turkey (t)OVA324-340 (B–E). Single cell speeds and MC of adoptively transferred cells (A and B), their arrest coefficient (C) and T cell–DC interaction times (E) were monitored by 2PM imaging. D shows representative 2PM images of DC interactions with WT (arrowheads) and TP−/− OT-II CD4+ T cells (arrows). An encircled HEV is seen in the top row. Time is shown in minutes and seconds. Bar, 10 µm. Each dot represents one track (A–C) or interaction (E). Data in A–C and E are pooled from at least two independent experiments and were analyzed by Mann-Whitney test. Red bars indicate median. *, P < 0.05; **, P < 0.01; ***, P < 0.001.

