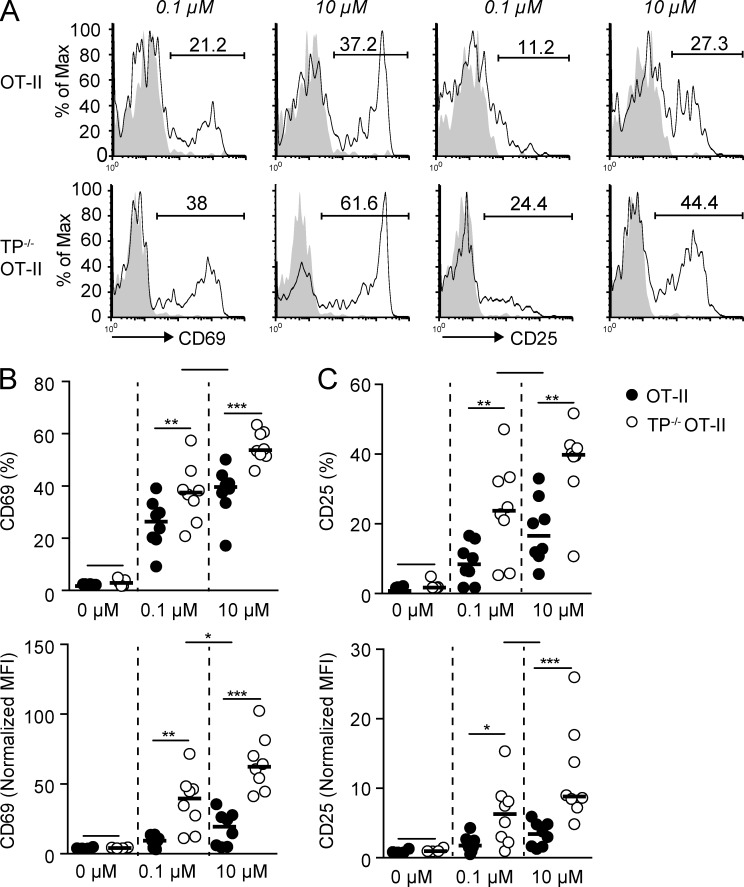
Figure 3.
TP−/− OT-II CD4+ T cells display increased activation marker expression as compared with WT OT-II CD4+ T cells. (A-C) WT and TP−/− OT-II CD4+ T cells were analyzed by flow cytometry 24 h after adoptive transfer in presence of DCs pulsed with low (0.1 µM) and high (10 µM) OVA323-339 concentrations. A shows representative flow cytometry plots of CD25 and CD69 expression. Numbers indicate percent positive cells. Percentages and normalized MFI of CD69+ (B) and CD25+ (C) transferred WT and TP−/− OT-II CD4+ T cells are shown. Each dot in B and C represents PLNs pooled from one mouse. Data are from 2–3 independent experiments with a total of 6–8 mice and analyzed using repeated measure ANOVA with Bonferroni post-test. Bars indicate mean. *, P < 0.05; **, P < 0.01; ***, P < 0.001.

