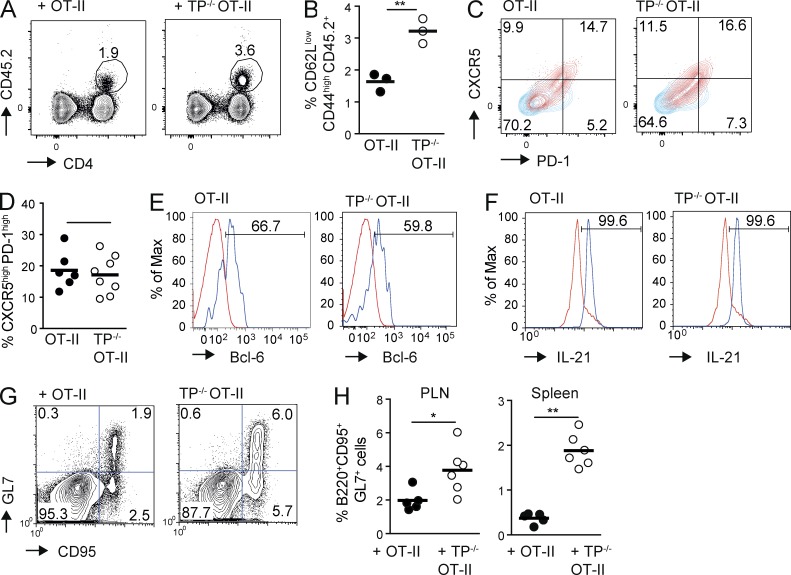
Figure 4.
Increased numbers of TFH in the absence of TP in OT-II CD4+ T cells. (A–H) WT and TP−/− OT-II CD4+ T cells were adoptively transferred separately (A–D and F–H) or combined (E) into CD45.1+ WT mice before immunization with OVA/CFA and analyzed on day 8 by flow cytometry. (A) Flow cytometry after pregating on CD44high CD62Llow lymphocytes. Numbers indicate the percentage of circled CD45.2+ cells. (B) Percentage of adoptively transferred CD45.2+ T cells as pregated in A. (C) PD-1 and CXCR5 expression on transferred WT and TP−/− OT-II T cells (red), with numbers indicating percent per quadrant field. CD4+ T cells from a nonimmunized mouse serve as negative control (blue). (D) Percentage of PD-1high CXCR5high CD45.2+ WT or TP−/− OT-II CD4+ T cells on day 8 after OVA/CFA immunization. Shown is one of three experiments, pooling TFH from spleens and PLNs of 3–4 mice on day 8 after OVA/CFA immunization. (E) Flow cytometric analysis of intracellular bcl-6 expression (blue) in PD-1high CXCR5high WT or TP−/− OT-II CD4+ T cells on day 8 after OVA/CFA immunization. As negative control, we plotted the endogenous CD45.1+ CD4+ cell signal (red), which gave an overlapping labeling as the isotype control (not depicted). (F) Flow cytometric analysis of intracellular IL-21 expression (blue) in CXCR5high WT or TP−/− OT-II CD4+ T cells on day 8 after OVA/CFA immunization. As negative control, we plotted the CD45.1+ CD4+ cell signal from a nonimmunized mouse (red), which gave an overlapping labeling as the isotype control (not depicted). (G) Flow cytometry plots of B220+ cells containing GL-7+ CD95+ GC B cells in WT or TP−/− OT-II T cell recipient mice on day 8 after OVA/CFA immunization with numbers indicating percent per quadrant field. (H) Percentage of GC B cells in WT or TP−/− OT-II T cell recipient mice 8 d after OVA/CFA immunization in PLNs and spleen. Each dot represents one mouse. Data are representative of three (A–F) or pooled from two (H) independent experiments with a total of 9–10 and 5–6 mice, respectively, and analyzed using Mann-Whitney test (B, D, and H). Bars indicate mean. *, P < 0.05; **, P < 0.01.

