Figure 1.
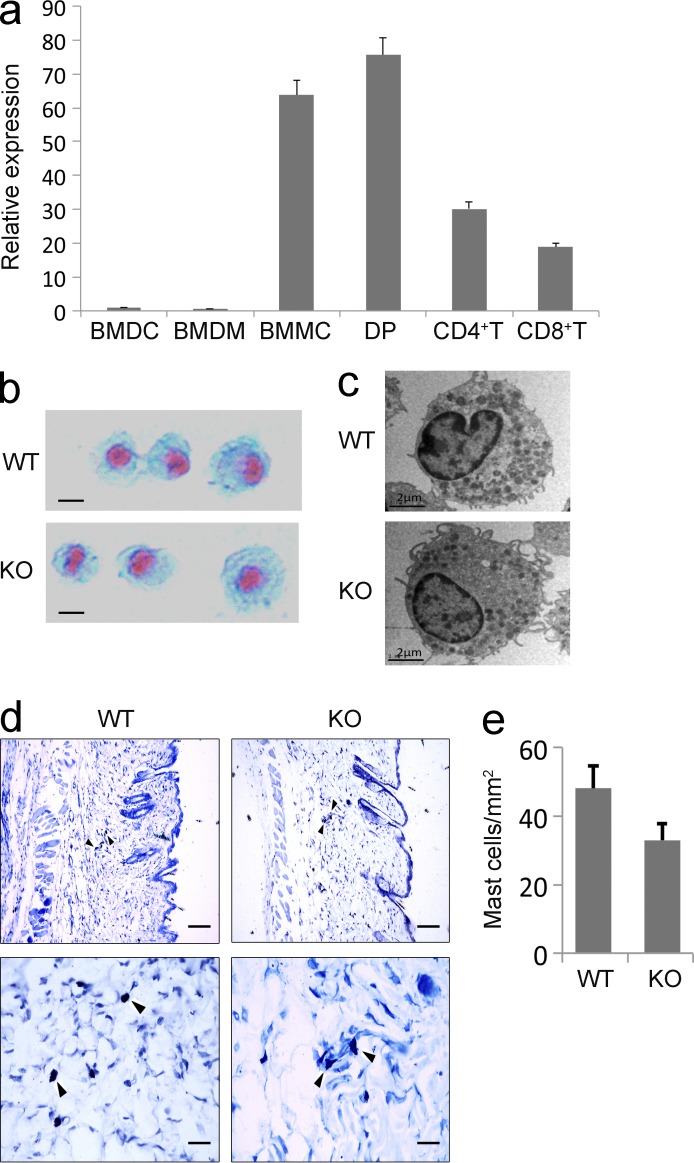
Tespa1 expression and BMMCs from WT and Tespa1-deficient mice. (a) Tespa1 mRNA expression in various cell subsets was measured by RT-PCR. Results are presented relative to Actb expression. Error bars represent SD. (b) BMMCs were stained with Alcian blue-Safranin O. Bars, 2 µm. (c) BMMCs were analyzed by electron microscopy. Bars, 2 µm. (d) Tissue mast cells in skin sections were stained with toluidine blue. Arrowheads indicate mast cells stained with toluidine blue. Bars: (top row) 100 µm; (bottom row) 25 µm. (e) Absolute numbers of mast cells per mm2 (mean and SD). Data are representative of three experiments.

