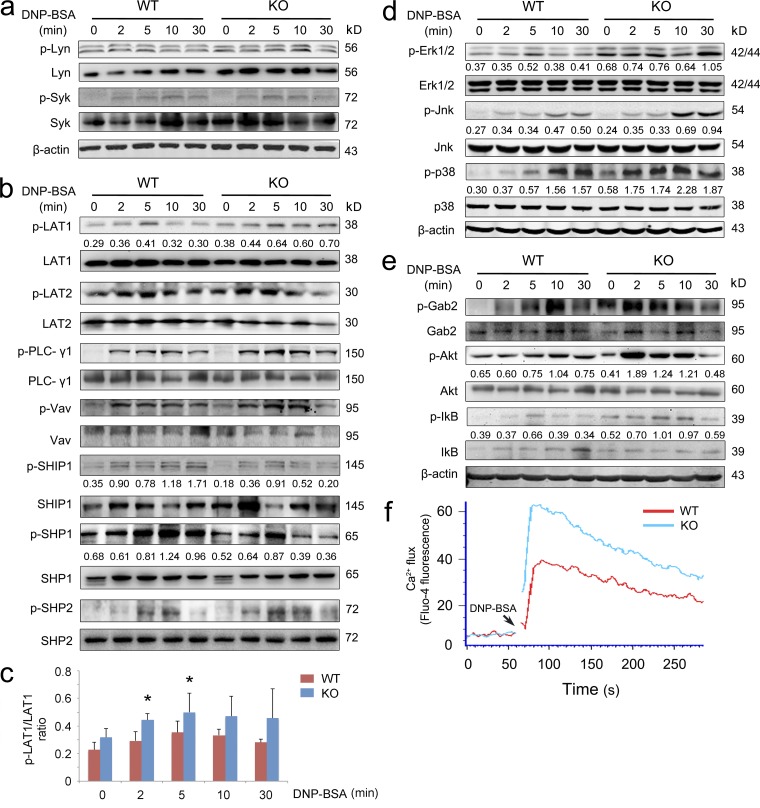
Figure 6.
FcεRI-mediated cell signaling in Tespa1 WT and KO BMMCs. (a–c) Levels of phosphorylated Lyn and Syk (a); total and phosphorylated LAT1, LAT2, PLC-γ1, Vav, SHIP1, SHP1, and SHP2 (b); and phosphorylated LAT1 (c) were measured by immunoblot. Phospho-LAT1 was normalized to total LAT1 by densitometry statistical analysis. Error bars represent SD. (d–f) BMMCs were sensitized with anti-DNP IgE and then stimulated with DNP-BSA for 2, 5, 10, or 30 min or left unstimulated. (d and e) Total and phosphorylated Erk, Jnk, and p38 (d); and total and phosphorylated Gab2, Akt, and IκB (e) in cell extracts were assessed by immunoblot. (f) Calcium flux was measured at the indicated times after stimulation. Data are representative of three experiments. *, P < 0.05.

