Figure 10.
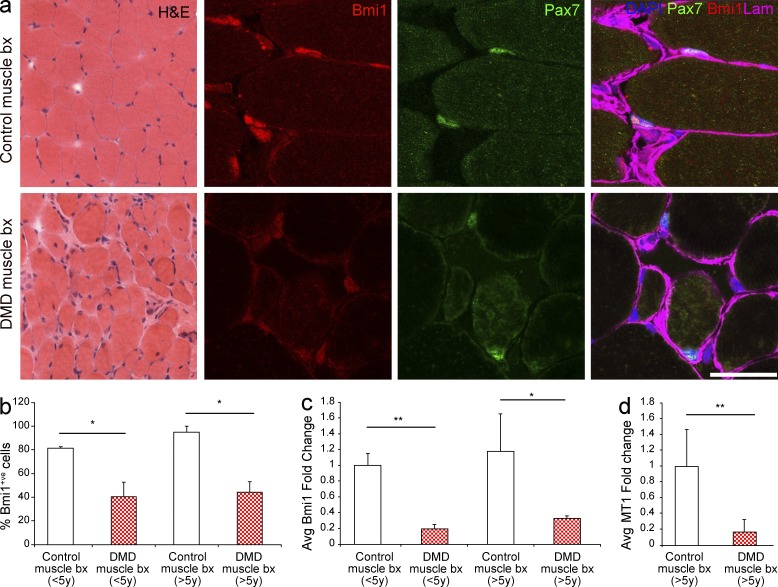
Bmi1 expression is reduced in the muscle of human DMD cases. (a) H&E staining of a DMD case as compared with an age-matched morphologically normal control. The same muscles are double stained for Bmi1 and Pax7 (representative results from two different cases). (b) Quantification of Bmi1+ve cells in DMD muscle biopsies and age matched controls (mean ± SEM from two independent experiments with n = 2 control and DMD in both age groups, five high power fields/case; *, P < 0.05; **, P < 0.01). (c) Levels of expression of Bmi1 are analyzed by qRT-PCR in the muscle biopsies of DMD patients as compared with age matched unaffected muscles (mean ± SEM from two independent experiments, n = 3 control and n = 2 DMD in both age groups, two technical replicas for each case; *, P < 0.05; **, P < 0.01). (d) Expression levels of MT1 are measured by qRT-PCR in the muscle biopsies of DMD patients >5 yr compared with age-matched unaffected muscles (mean ± SEM from two independent experiments with n = 3 control and n = 2 DMD in both age groups, two technical replicas for each case; *, P < 0.05; **, P < 0.01). Bar: (H&E) 62.5 µm; (immunofluorescence) 31 µm.

