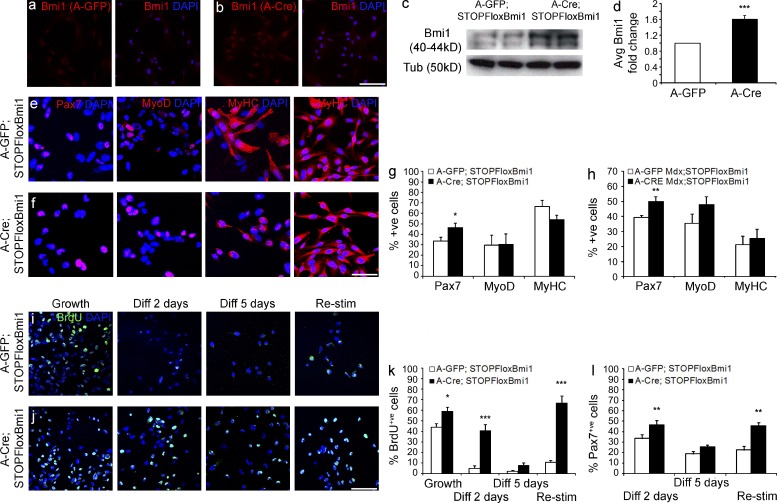
Figure 2.
Conditional Bmi1 activation in satellite cell cultures increases the percentage of Pax7+ve cells. (a and b) Satellite cells derived from P60 STOPFloxBmi1 single fibers, infected with A-GFP or A-Cre viruses and immunostained for Bmi1 (representative results from three independent experiments with n = 3 for each condition). (c and d) Levels of expression of Bmi1 are analyzed with WB (c; representative blot from 2 independent experiments with n = 4 biological samples) and qRT-PCR on the same samples (d; mean ± SEM from three independent experiments with n = 3 for each condition; ***, P < 0.001). (e and f) Representative images (e; 6 independent experiments with n = 8 for each condition) of satellite cell cultures infected with either A-GFP or A-Cre viruses (Bmi1Over cells; f) and stained for Pax7, MyoD, and MyHC, 2 and 5 d.a.i. in differentiation conditions. (g and h) Quantification of the findings in normal (g; mean ± SEM from six independent experiments with n = 8 for each condition; *, P < 0.05) and dystrophic context (h; mean ± SEM from 4 independent experiments with n = 4 for each condition; **, P < 0.01). (i and j) Representative images of the BrdU staining on A-GFP (i) and A-Cre–infected satellite cells (j) in four different conditions (six independent experiments with n = 8 for each condition): growth, 2 d differentiation, 5 d differentiation, and restimulation (i and j). (k) Quantification of BrdU+ve cells in growth, differentiation, and upon high serum restimulation conditions compared with A-GFP–infected satellite cells (mean ± SEM from six independent experiments with n = 8 for each condition; *, P < 0.05; ***, P < 0.001). (l) Quantification of Pax7+ve satellite cells in Bmi1Over satellite cells compared with A-GFP–infected satellite cells in growth, differentiation, and upon high serum restimulation conditions (mean ± SEM from four independent experiments with n = 4 for each condition; *, P < 0.05; **, P < 0.01). Bars, 62.5 µm. Bmi1Over: Bmi1-overexpressing cells.

