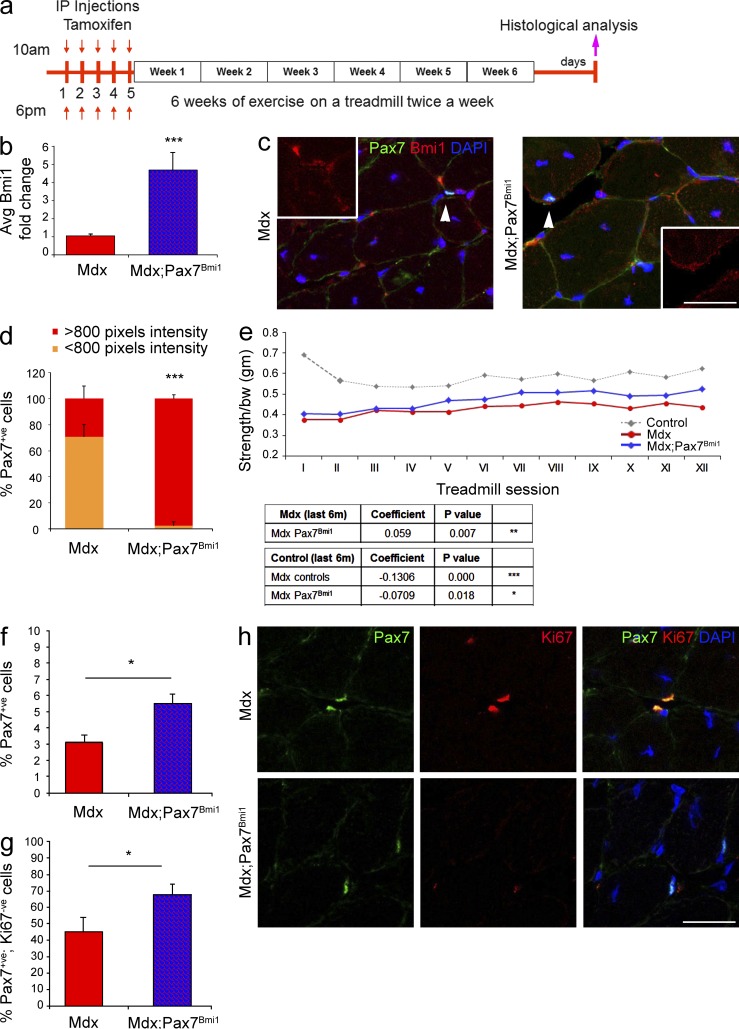
Figure 3.
Conditional activation of Bmi1 expression in satellite cells improves muscle strength in dystrophic muscles in vivo. (a) Schematic temporal summary of the experiment. (b and c) Quantification of Bmi1 expression upon Tamoxifen injections in mdx;Pax7Bmi1 mice compared with controls at RNA (b, mean ± SEM from four independent experiments with n = 12 mdx;Pax7Bmi1 and n = 12 mdx; ***, P < 0.001) and at protein level (c; arrowheads indicate a Pax7+ve cell then included in the insert, representative results from two independent experiments with n = 4 mdx, n = 3 mdx;Pax7Bmi1, n = 12 fields for mdx, and n = 11 fields for mdx;Pax7Bmi1). (d) Quantification of Bmi1 pixel intensity in mdx;Pax7Bmi1 mice compared with controls (mean ± SEM from two independent experiments with n = 4 mdx, n = 3 mdx;Pax7Bmi1, n = 12 fields for mdx, and n = 11 fields for mdx;Pax7Bmi1; ***, P < 0.001). (e) The progression of the muscle pathology is followed by the forelimb grip strength test before each treadmill session. The table reports the statistical significant differences between groups and the coefficient representing the improving (if positive) or worsening (if negative) of the phenotype (four independent experiments with n = 5 controls, n = 9 mdx, n = 11 mdx;Pax7Bmi1; mdx vs. mdx;Pax7Bmi1: **, P < 0.01; mdx vs. control: ***, P < 0.001; and control vs. mdx;Pax7Bmi1: *, P < 0.05). (f and g) Quantification of Pax7+ve cells in mdx;Pax7Bmi1 and mdx control (f) and quantification of double-positive cells Pax7+ve/Ki67+ve in mdx;Pax7Bmi1 and mdx control (g; mean ± SEM from n = 3 mdx, n = 7 mdx;Pax7Bmi1; *, P < 0.05). (h) Representative images of muscle sections stained for Pax7 and Ki67 in mdx;Pax7Bmi1 as compared with mdx mice (n = 3 mdx, n = 7 mdx;Pax7Bmi1; *, P < 0.05). Mdx;Pax7CreERT2;STOPFloxBmi1: mdx;Pax7Bmi1 (Bmi1 overexpression in satellite cells in a dystrophic environment). Bars: (c) 125 µm; (h) 62.5 µm.

