Figure 6.
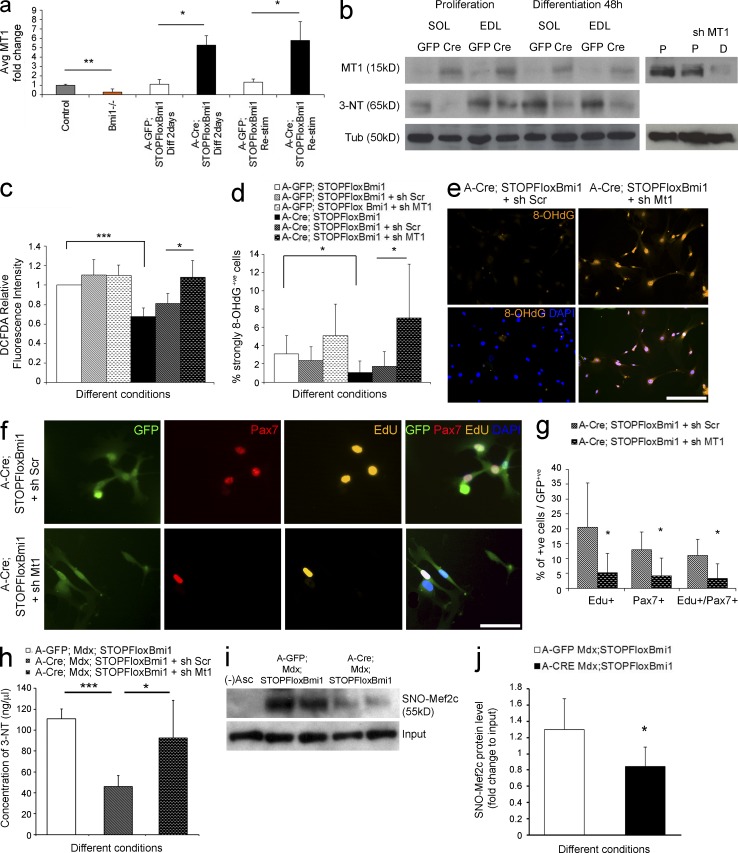
The satellite cell pool is increased by Bmi1 overexpression in vitro via up-regulation of MT1. (a) Relative expression level of MT1 in Bmi1−/−, Bmi1Over, and control satellite cells (mean ± SEM from two independent experiments with n = 3 for each condition; *, P < 0.05; **, P < 0.01). (b) Expression levels of MT1 are also analyzed at the protein level in Bmi1 Over satellite cells both in growth and differentiation-inducing conditions (left, three independent experiments with n = 3 for each condition). Efficient knock down of MT1 is also shown in proliferation (P) and differentiation (D) conditions (b, right; representative results from three independent experiments with n = 3 for each condition). WB analysis of the levels of 3-NT modification in Bmi1Over satellite cells both in proliferation and differentiation-inducing conditions (b, left; three independent experiments with n = 3 for each condition). (c) The amount of ROS production is measured via DCFDA relative fluorescence intensity in Bmi1Over satellite cells compared with controls and treated with either sh Scramble or knockdown of MT1 (mean ± SEM from two independent experiments with n = 4 for each condition; *, P < 0.05; ***, P < 0.001). (d and e) Quantification of the percentage of strongly 8OHdG+ve satellite cells in Bmi1Over cultures with and without knockdown of MT1 (mean ± SEM from two independent experiments with n = 4 for each condition; *, P < 0.05) and representative examples of immunolabeling (e) are shown. (f) Representative examples of immunolabeling for Pax7 and Edu in Bmi1Over satellite cell cultures upon MT1 knockdown (two independent experiments with n = 4 for each condition). (g) Quantification of the percentage of Edu+ve or Pax7+ve or Edu+ve/Pax7+ve cells is shown (mean ± SEM from two independent experiments with n = 4 for each condition; *, P < 0.05). (h) Total concentration of nitrosylated proteins (ng/µl) in Bmi1Over mdx;Bmi1Over satellite cells compared with A-GFP–infected controls, with and without Mt1 knockdown (mean ± SEM from two independent experiments with n = 4; ***, P < 0.001; *, P < 0.05). (i and j) The level of SNO-Mef2c is shown in mdx;Bmi1Over satellite cells compared with controls A-GFP–infected satellite cells as assessed by a modified biotin switch assay, followed by immunoblot (i) and quantification (j; mean ± SEM from two independent experiments with n = 4; *, P < 0.05). MT1: Metallothionein1; 8OHdG: 8-HydroxydeoxyGuanosine; MT1 up: MT1 up-regulation; MT1 nc: MT1 not changed. Bars: (e) 125 µm; (f) 62.5 µm.

