Figure 7.
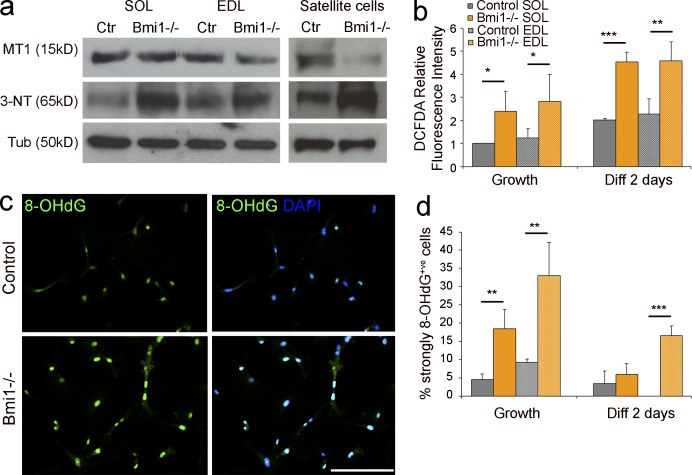
Increased ROS production and oxidative-stress induced DNA and protein damage in Bmi1−/− cells is accompanied by MT1 down-regulation. (a) Protein analysis of MT1 and 3-NT levels in Bmi1−/− muscle tissue and satellite cells cultures (representative results from three independent experiments with n = 3 for each condition). (b) The amount of ROS production is measured via DCFDA relative fluorescence intensity in Bmi1−/− satellite cells compared with controls isolated from both SOL and EDL and cultured either in growth or differentiation conditions (mean ± SEM from two independent experiments with n = 4 for each condition; *, P < 0.05; **, P < 0.01; ***, P < 0.001). (c) Immunolabeling for 8-OHdG in Bmi1−/− satellite cell cultures and controls (representative results from two independent experiments with n = 4 for each condition). (d) Quantification of 8-OHdG+ve cells in Bmi1−/− satellite cell cultures and controls in both growth and differentiation conditions (mean ± SD from two independent experiments with n = 4 for each condition; **, P < 0.01; ***, P < 0.001). Bar, 125 µm.

