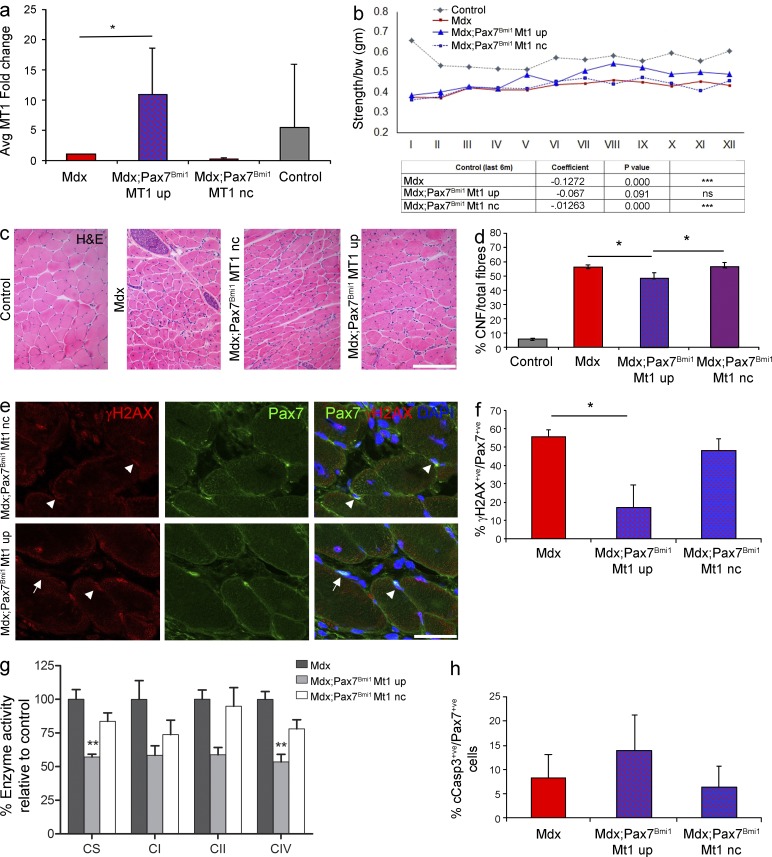
Figure 8.
Bmi1-driven improved muscle strength in dystrophic mice is mediated by concomitant up-regulation of MT1. (a) Relative expression of MT1 in mdx;Pax7Bmi1 compared with mdx control mice (mean ± SEM from three independent experiments with n = 19 mdx, n = 4 mdx;Pax7Bmi1 Mt1 UP, n = 6 mdx;Pax7Bmi1 Mt1 nc, and n = 5 controls; *, P < 0.05). (b) mdx;Pax7Bmi1 forelimb grip strength test is reanalyzed taking into account MT1 up-regulation (mean from four independent experiments with n = 19 mdx, n = 4 mdx;Pax7Bmi1 Mt1 UP, n = 6 mdx;Pax7Bmi1 Mt1 nc, n = 5 controls; control vs mdx: ***, P < 0.001; control vs. mdx;Pax7Bmi1 Mt1 UP: control vs. mdx;Pax7Bmi1 Mt1 nc: ***, P < 0.001). (c) H&E staining of representative fields of forelimbs of controls, mdx, and mdx;Pax7Bmi1 with and without MT1 up-regulation (representative results from four independent experiments with n = 6 controls, n = 19 mdx, n = 4 mdx;Pax7Bmi1 Mt1 UP, and n = 6 mdx;Pax7Bmi1 Mt1 nc). (d) Quantification of CNF of mdx;Pax7Bmi1 with and without MT1 up-regulation in mdx;Pax7Bmi1 MT1 up mice, mdx;Pax7Bmi1 MT1 nc, and mdx mice (mean ± SEM from four independent experiments with n = 6 controls, n = 19 mdx, n = 4 mdx;Pax7Bmi1 Mt1 UP, and n = 6 mdx;Pax7Bmi1 Mt1 nc; mdx vs. mdx;Pax7Bmi1 Mt1 UP: *, P < 0.05; mdx vs mdx;Pax7Bmi1 nc UP: *, P < 0.05). (e and f) Immunolabeling for Pax7 and γH2AX (e, representative results from n = 5 mdx, n = 4 mdx;Pax7Bmi1 Mt1 UP, and n = 6 mdx;Pax7Bmi1 Mt1 nc; arrowhead: γH2AX+ve;Pax+ve; arrow: Pax7+ve) in mdx;Pax7Bmi1 MT1 UP compared with mdx controls and mdx;Pax7Bmi1 MT1 nc (f [quantification]; mean ± SEM from n = 5 mdx, n = 4 mdx;Pax7Bmi1 Mt1 UP, and n = 6 mdx;Pax7Bmi1 Mt1 nc; *, P > 0.05). (g) The activities of mitochondrial respiratory chain enzymes including complex I (NADH: ubiquinone oxidoreductase (CI)), complex II (succinate:ubiquinone oxidoreductase (CII)), and complex IV (cytochrome c oxidase (CIV)) and the matrix marker citrate synthase (CS) are determined in post–600 g supernatants prepared from frozen gastrocnemius muscle samples from mdx and mdx;Pax7Bmi1 mice either up-regulating MT1 or not. Activities (calculated relative to mitochondrial protein) are shown relative to those observed in mdx mice (denoted 100% activity; mean ± SEM from one experiment with n = 5 mdx, n = 4 mdx;Pax7Bmi1 MT1 UP, and n = 6 mdx;Pax7Bmi1 MT1 nc; **, P < 0.01). (h) Quantification of double staining for Pax7 and Cleaved Caspase3 (cCasp3) on the forelimb of mdx and mdx;Pax7Bmi1 mice with up-regulation of MT1 and mdx;Pax7Bmi1 mice with MT1 nc after 6 wk of treadmill exercise (mean ± SEM from one experiment with n = 5 mdx, n = 4 mdx;Pax7Bmi1 MT1 UP, and n = 5 mdx;Pax7Bmi1 MT1 nc). Bars, 62.5 µm.

