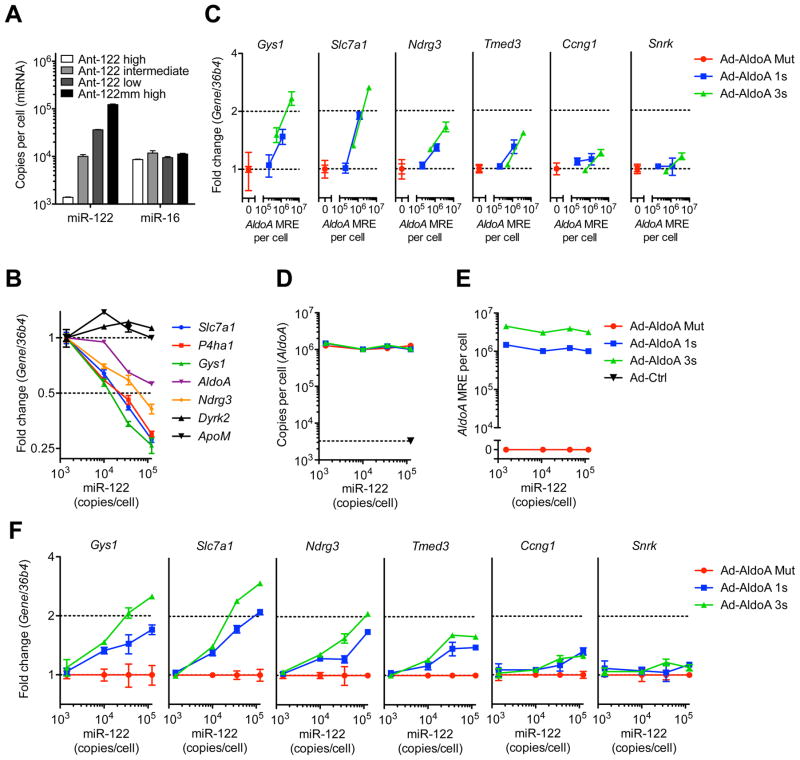
Figure 2. The high threshold persists after lowering miR-122 activity.
(A) Absolute miRNA copy numbers per cell, or (B) relative expression of miR-122 target genes and control non-target genes (Dyrk2 and ApoM) in primary hepatocytes from mice treated with Ant-122mm or different concentrations of Ant-122. Values for miR-122 target and control genes are normalized to that of the lowest miR-122 concentration.
(C) Relative expression of miR-122 target genes and a non-target gene (Snrk) in primary hepatocytes with 3-fold decreased miR-122 levels shown in (A), infected with MOI 20 and 200 of Ad-AldoA Mut (red), 1s (blue) or 3s (green).
(D–F) Primary hepatocytes shown in (A) infected with MOI 200 of the three Ad-AldoA constructs. Absolute copy numbers per cell of AldoA (D) and AldoA MRE (E) in relation to miR-122 copy numbers.
(F) Relative expression of miR-122 target genes and control non-target gene (Snrk), normalized to Ad-AldoA Mut of the respective miR-122 condition.
Absolute miRNA copy numbers were calculated by multiplying relative abundance (miRNA/snoRNA202) that were normalized to Ant-122mm with the copy number evaluated in Figure 1B. Data represent mean ± SEM (n = 4) for all panels.

