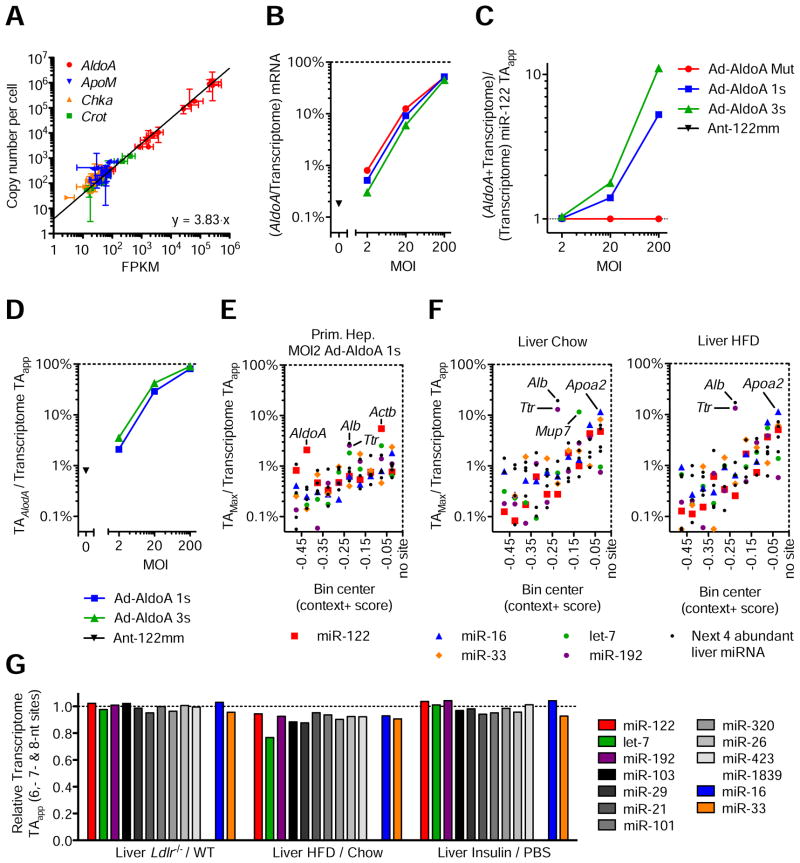
Figure 4. Modest changes in target abundance are induced by metabolic stress and disease.
(A) Relationship between FPKM from RNA-seq data and absolute quantification using qPCR. Represented are four genes quantified in all 11 primary hepatocyte samples, plus wildtype and Ldlr−/−liver samples. Line represents linear regression of data points. Data represent mean ± 95% confidence intervals.
(B–D) RNA-seq data from primary hepatocytes infected with MOI 200, 20, and 2 of Ad-AldoA Mut, 1s, or 3s shown in Figure 1C–H. Data represent mean ± SEM. (B) Contribution of AldoA mRNA to the sum of genome mRNA. (C) Increase of transcriptome miR-122 TAapp (D) and the respective contribution of AldoA MRE to total transcriptome miR-122 TAapp mediated by the different Ad-AldoA constructs and viral concentrations.
(E–F) Fractional contribution of the largest potential contributors to transcriptome TAapp in primary hepatocytes infected with MOI 2 of Ad-AldoA 1s (E) or in wildtype livers (F) originated from mice either fed normal chow or high-fat diet (HFD). Potential contributors were binned by their context+ score, and the top potential contributors are plotted within each bin. See also Figure S4 and Table S2.
(G) Relative target abundance of livers from models of physiological (Insulin) or disease/stress states (Ldlr−/−and HFD).

