Figure 1.
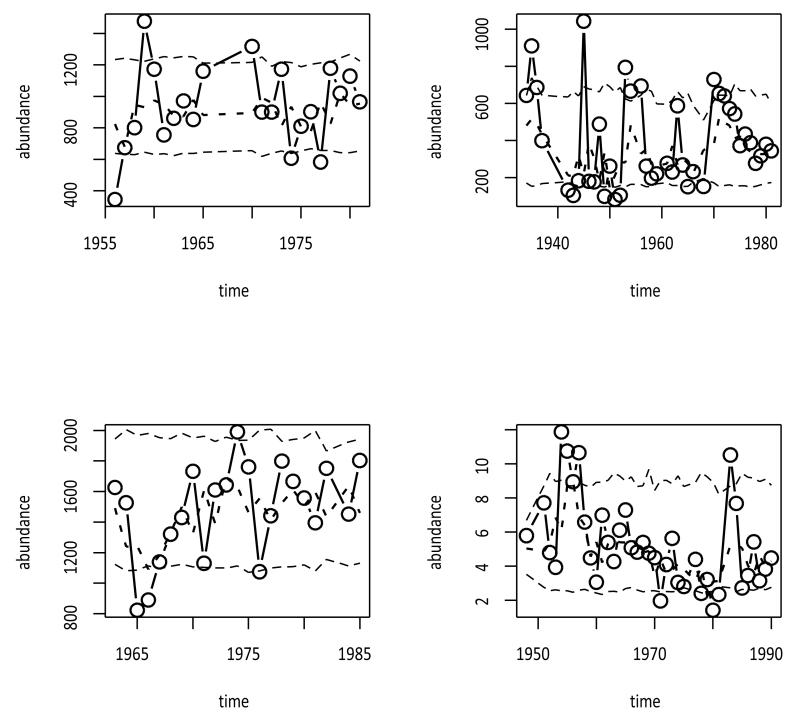
Four population abundance time series (circles), with expected values of true abundances given the other observations (short dashed lines), and bootstrapped 95% confidence intervals for true abundances (long dashed lines), estimated with restricted maximum likelihood under the Ornstein-Uhlenbeck state space model. Upper left: bobcat furbearer harvest records from Idaho, USA (parameter estimates with bootstrapped 95% confidence intervals: , , , ). Upper right: bobcat furbearer harvest records from Maine, USA (, , , ). Lower left: elk population estimates from Grand Teton National Park, Wyoming, USA (, , , ). Lower right: grasshopper density estimates from the western mountainous region of Montana, USA (, , , ).

