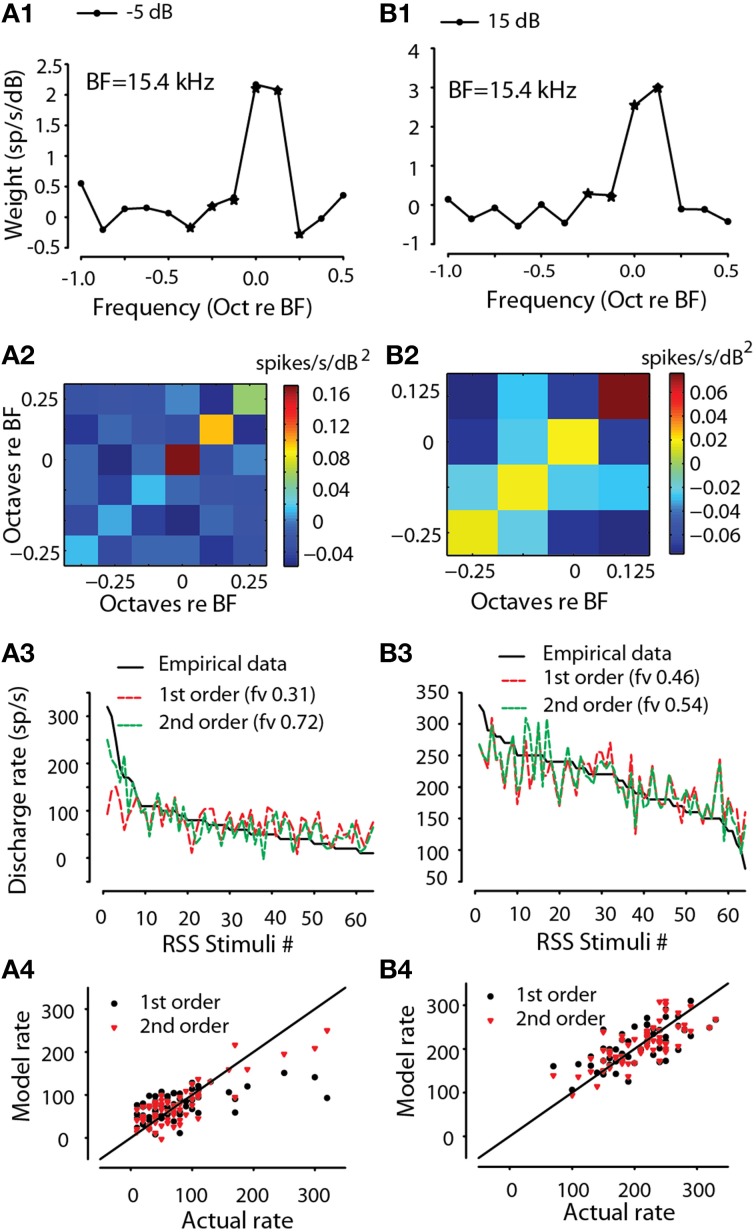
Figure 3.
Encoding of sound spectra by MNTB neuron via RSS method. First order (linear) spectral weight functions for one neuron (CF = 15.4 kHz) at two levels re: threshold (A1 −5 dB, B1 15 dB). Second-order weights for the same two levels (A2,B2). Empirical discharge rates plotted rank-ordered vs. RSS stimuli (black line) along with the predicted rates using the estimated first-order (red line) and full-order (green line) spectral weight models for the same two levels (A3,B3). The fraction of explained variance, fv, is indicated for each model. Scatter plot of modeled rate vs. empirical rate for first-order (black) and full-order (red) models for the same two levels (A4,B4). Solid line is line of equality.

