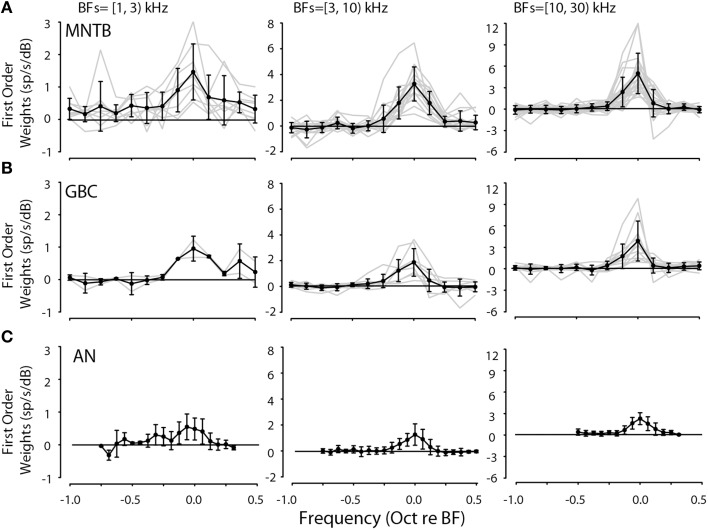
Figure 5.
First-order linear weight functions for all 42 MNTB (A) and 21 GBC (B) neurons studied binned according to BF (BF ranges in upper left of each panel). Weight functions were taken from spectral levels in the range of 5–15 dB. Weight function for auditory nerve fibers (AN, C) are replotted from Young and Calhoun (2005). In each panel, the light gray lines indicate weight functions for individual neurons while the solid line with symbols and error bars indicate the across-neuron mean weight function ±1 standard deviation. Generally, the weight functions in each range of BFs were similar in terms of shape and magnitude.

