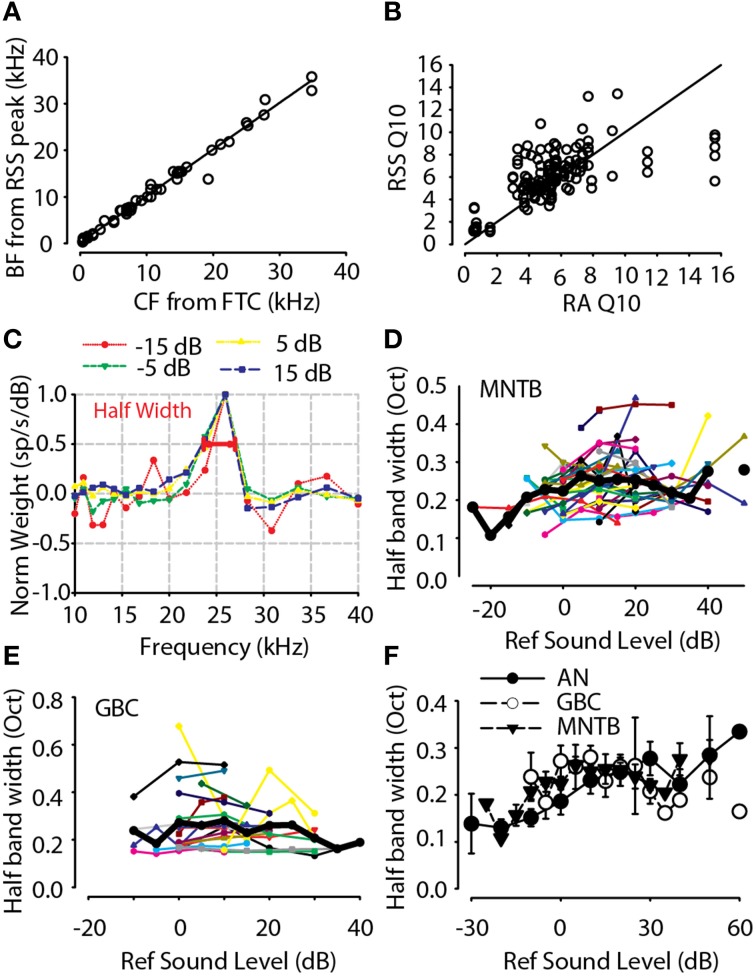
Figure 7.
(A) BF estimated from the RSS weight function as a function of the CF measured from pure tone frequency-intensity response area. (B) Frequency tuning estimated from the RSS weight functions (RSS Q10, see text for equation) for all neurons and all levels tested as a function of Q10 measured from pure tone frequency-intensity response area (RA Q10). (C) First-order weight function for one neuron (BF = 25.9 kHz) computed over a range of sound levels (−15 to 15 dB). The weight function for each sound level has been normalized by the maximum weight at BF at each particular sound level. For higher sound levels (> −15 dB), the normalized weight function shapes were similar. The bandwidth of the weight functions was computed at one-half the maximum weight at BF (see bar at normalized weight of 0.5). Significant off-BF inhibition (negative weights) can be seen at higher levels (error bars not shown for clarity). (D) Half-height bandwidth for 38 high-BF (>3 kHz) MNTB neurons as a function of sound level re: threshold. Lines and points show data for individual neurons while the solid black line shows the across-neuron mean. (E) Same as in (D), but for GBC neurons. (F) Across-neuron mean spectral selectivity of GBC and MNTB neurons was quite consistent, or level-tolerant, across a wide range levels while the selectivity of AN neurons tended to widen. AN data replotted from Young and Calhoun (2005).

