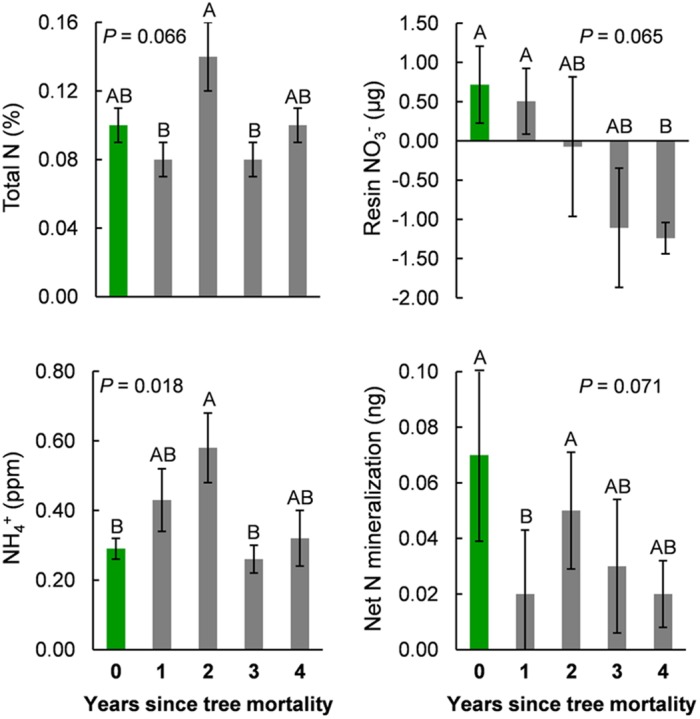
FIGURE 5.

Measures of total soil N (upper-left), ammonium (, lower-left), plant available nitrogen ( measured from ion-exchange resin bags, upper-right), and net nitrogen mineralization from in situ incubation experiments (lower-right) across a 5-year chronosequence of bark beetle-induced tree mortality. Year zero (0, green bars) represents samples collected under live trees that were not attacked by bark beetles during the study. All other samples were collected from under trees attacked and killed by bark beetles one to four (1–4, gray bars) years prior to field sampling.
