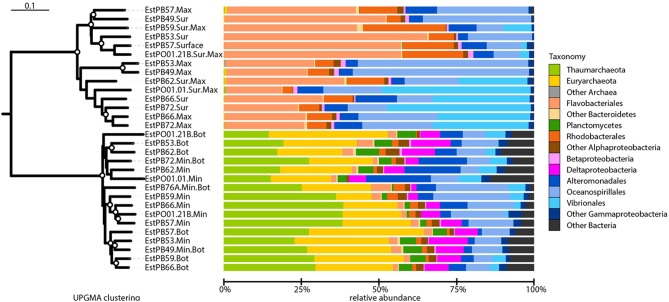
Figure 4.
Beta-diversity analysis and taxonomic composition of Southern Ocean samples collected from near the seafloor (Bot), at the minimum or maximum oxygen depth (Min or Max, respectively), or at the surface (Sur). Samples IDs are as shown in Table 2. Left: unweighted pair group method with arithmetic mean (UPGMA) dendrogram based on weighted-normalized unifrac distances. Bootstrap values higher than 50% based on 100 resamplings are shown as white circles on the branches. The bar represents 10% dissimilarity. Right: relative abundances of archaeal and bacterial taxa. Some major taxa are shown at the order level for better taxonomic resolution.

