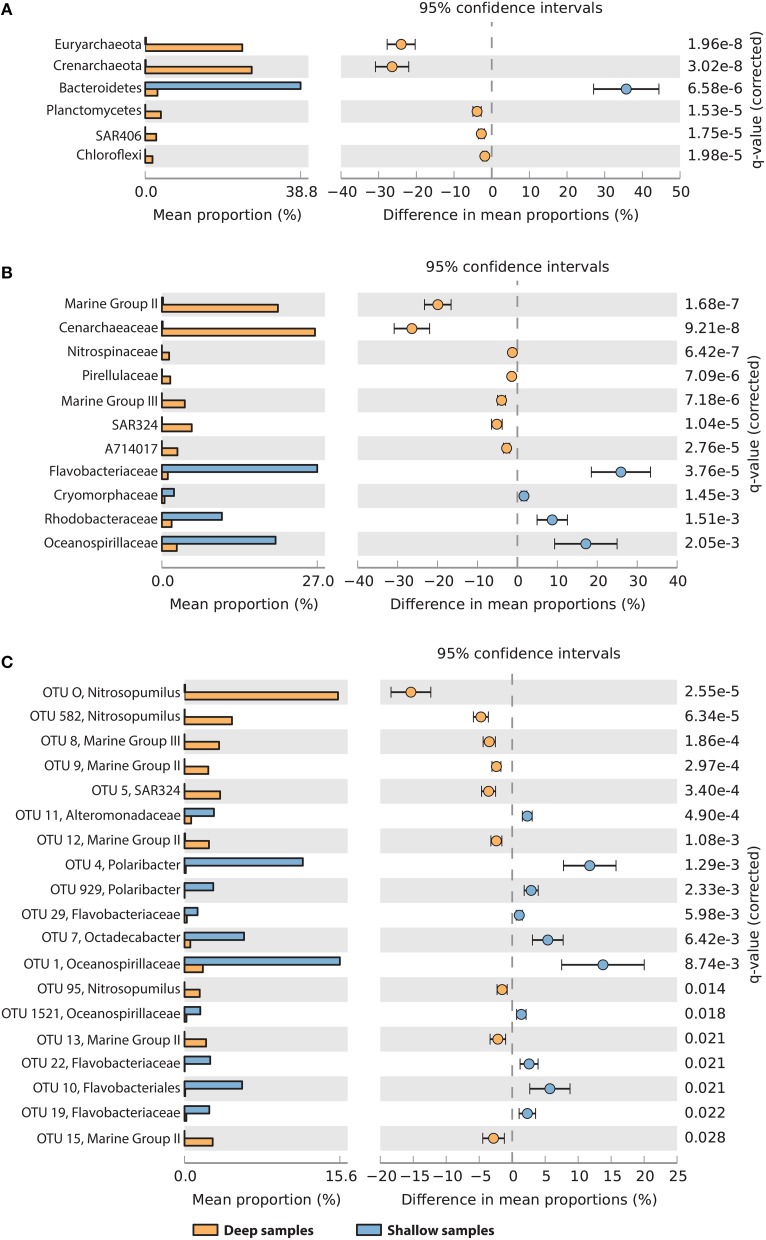
Figure 6.
Taxa showing significantly different relative abundances between “deep” samples (yellow, oxygen minimum, or seafloor) and “shallow” samples (blue, oxygen maximum or surface), at the phylum (A), family (B), and OTU (C) levels. For OTUs, the best taxonomic assignment is reported. Data were compared using Welch's t-test with FDR correction of p-values. Differences were considered significant if q < 0.05 and filtered for effect sizes (difference between proportions >1 or ratio between proportions >4).

