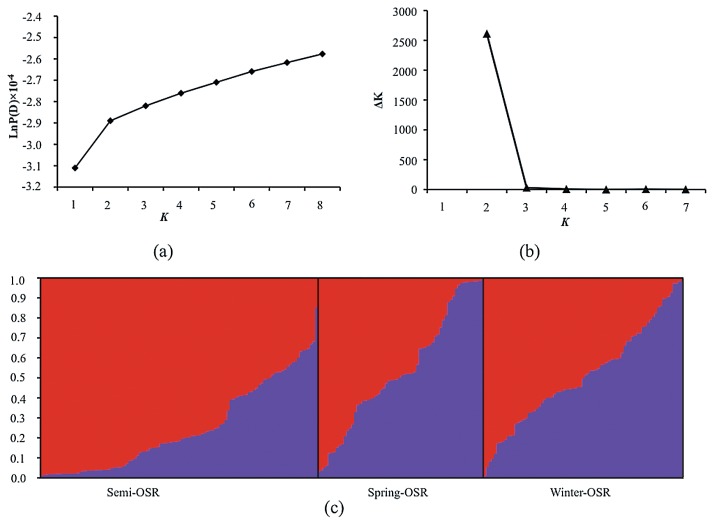
Fig. 2.
Analysis of the population structure of 248 rapeseed accessions by STRUCTURE. a. Estimated LnP(D) of possible clusters (K) from 1 to 8; b. ΔK based on the rate of change of LnP(D) between successive K; c. Population structure based on K = 2. Each individual is represented by a thin vertical line, which is partitioned into red and violet segments that represent the individual’s estimated membership fractions in two clusters. Black lines separate individuals of different germplasm types, which are labeled below the figure.

