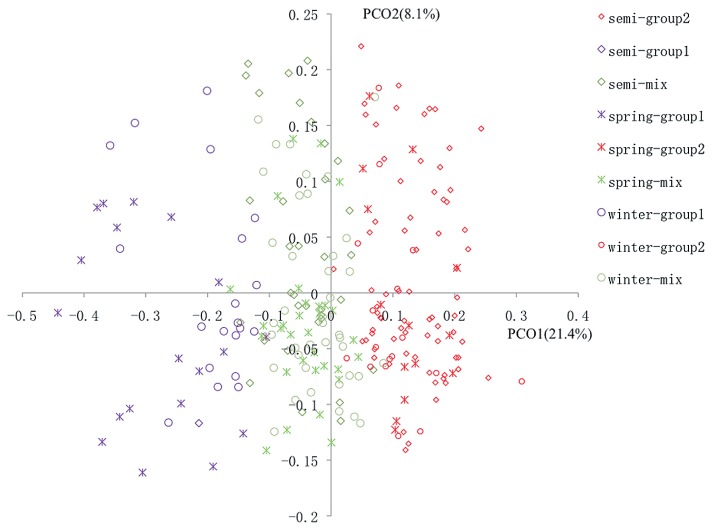
Fig. 3.
Principal coordinate (PCO) analysis of 248 rapeseed lines based on 45 SSR marekers. PCO1 and PCO2 are the two first principal coordinates and the proportion of variance explained by these coordinates is indicated in parentheses. Colors represent groups defined by STRCTURE and symbols represent germplasm types.

