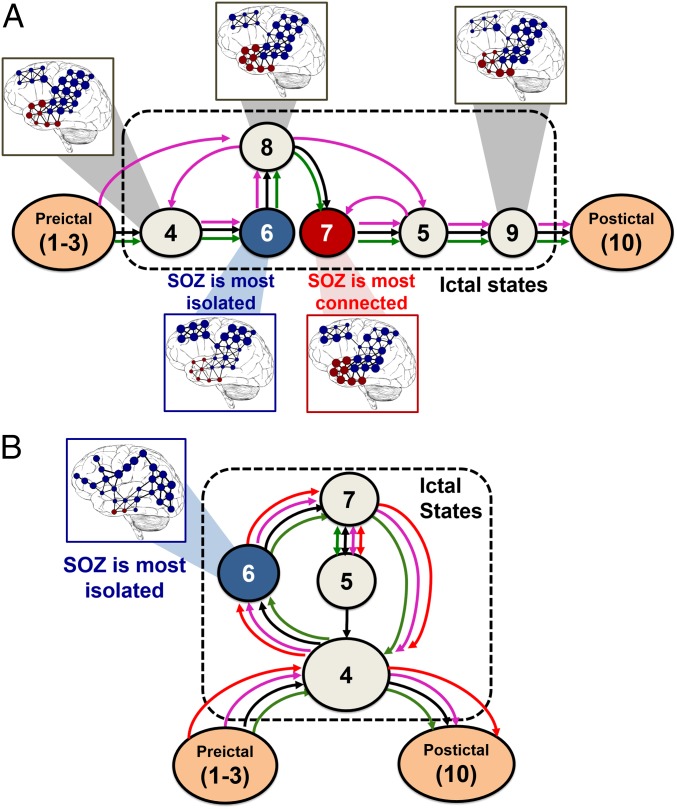
Fig. 5.
(A and B) State transition diagrams corresponding to the states in Fig. 3H (A) and Fig. 4H (B), respectively. The networks are overlapped with brain images for a few states. Red nodes denote the annotated seizure onset zone and the diameter of each node is proportional to its EVC. Note that, in the IF states, the EVCs of the focal regions are small, which indicates a loss of connectivity from the rest of the network. In the CF state, instead, the EVC of the seizure onset zone is largest. SOZ, seizure onset zone.

