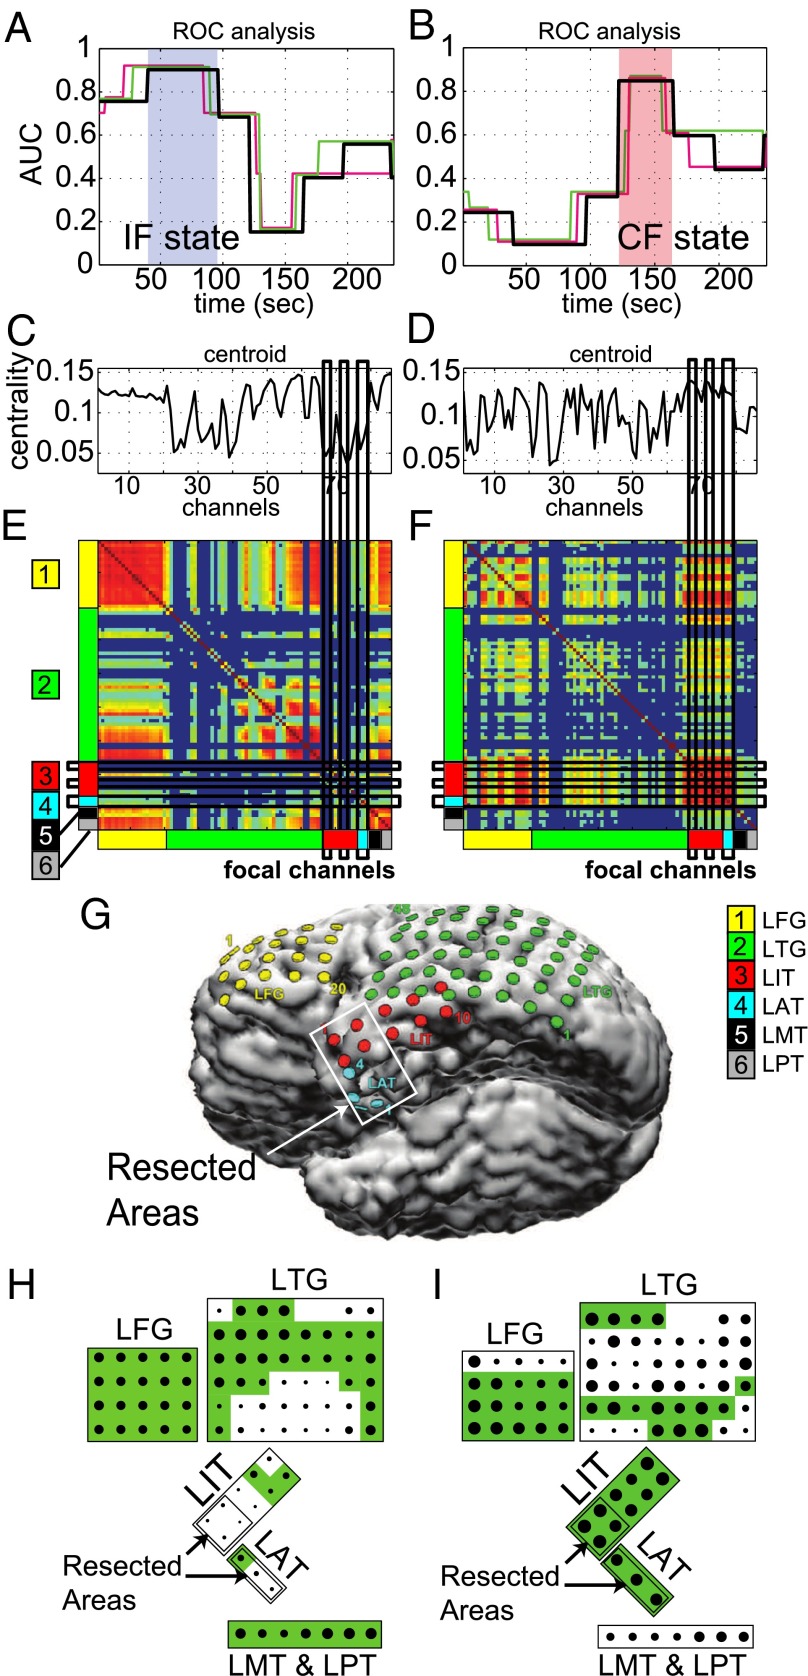
Fig. 6.
Receiver operator characteristic (ROC) analysis for the patient in Fig. 3. (A and B) Area under the ROC curve (AUC) generated by comparing the resected areas to the inverted centroids (A) and to the centroids (B) corresponding to the states in Fig. 3H. Color code is as in Fig. 3H. The states corresponding to the IF and CF are shaded in blue and red, respectively. (C and D) EVCs of the IF centroid corresponding to the shaded state in A (C) and EVCs of the CF centroid corresponding to the shaded state in B (D). (E and F) Average connectivity matrix assigned to the IF state (E) and the CF state (F). The location of the electrodes in the brain is labeled on the axes. Channels in the matrix align vertically with the centroid in C and D, respectively. (G) Location of the electrodes on the brain. The resected area is in the white box. (H and I) Schematic of the dominant connectivity in the IF state (H) and in the CF state (I). The magnitude of the EVCs is indicated by the size of the dots, the connected regions are shaded green, and the resected areas are labeled.

