Fig. 1.
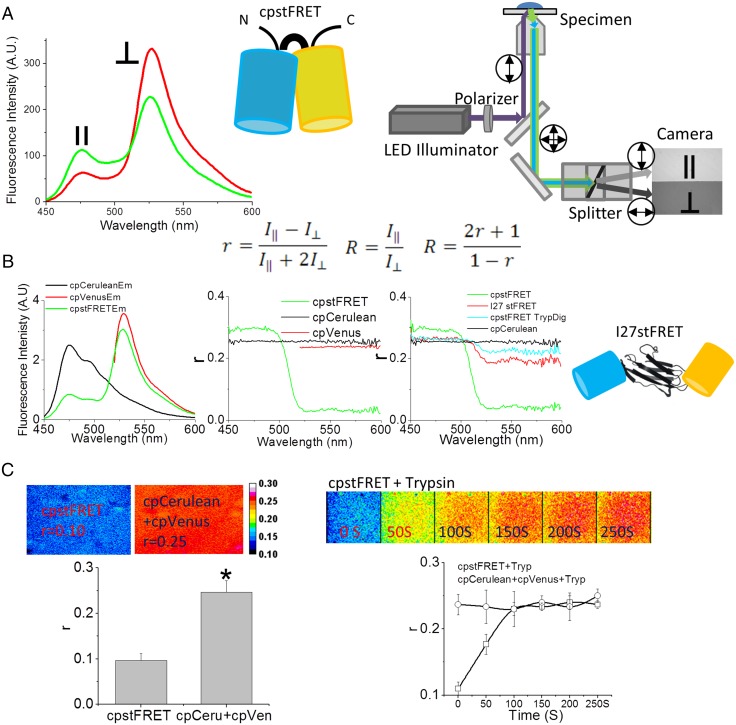
Fluorescence anisotropy is a sensitive method to detect FRET changes in cpstFRET. (A) Schematic diagram of the cpstFRET force sensor and the microscope setup. (Left) cpstFRET anisotropy scanned by a spectrofluorimeter; ‖, emission parallel to excitation; ⊥, emission perpendicular to excitation. (Middle) The cyan barrel represents cpCerulean, and the yellow barrel represents cpVenus. (Right) The wide-field fluorescence microscope setup for anisotropy measurements. Double-headed arrows indicate the polarization in the light path. (Equation Inset) R, anisotropy FRET ratio; r, anisotropy. (B) Anisotropy measured by spectrofluorimeter. (Left) The emission spectra of a purified protein solution of cpstFRET (green), cpVenus (red), and cpCerulean (black). (Middle) The emission spectral anisotropy of the three protein solutions. (Right) The anisotropy of cpCerulean (black), cpstFRET (green), cpstFRET after cleavage of the linker by trypsin for 20 s (cyan), and I27stFRET (red). Schematic diagram shows I27stFRET, with I27 as the linker between cpVenus and cpCerulean. (C) cpstFRET protein solution anisotropy measured in the microscope. (Left) FRET anisotropy, r, images of free-floating dilute probe cpstFRET (r = 0.1) and cpCerulean and cpVenus in a 1:1 ratio with no visible FRET (r = 0.25). (Right) R images of cpstFRET protein with linker cleaved by trypsin up to 250 s. All images were processed and pseudocolored by the 16-color map of ImageJ. The calibration bar was set from 0.08 to 0.30.

