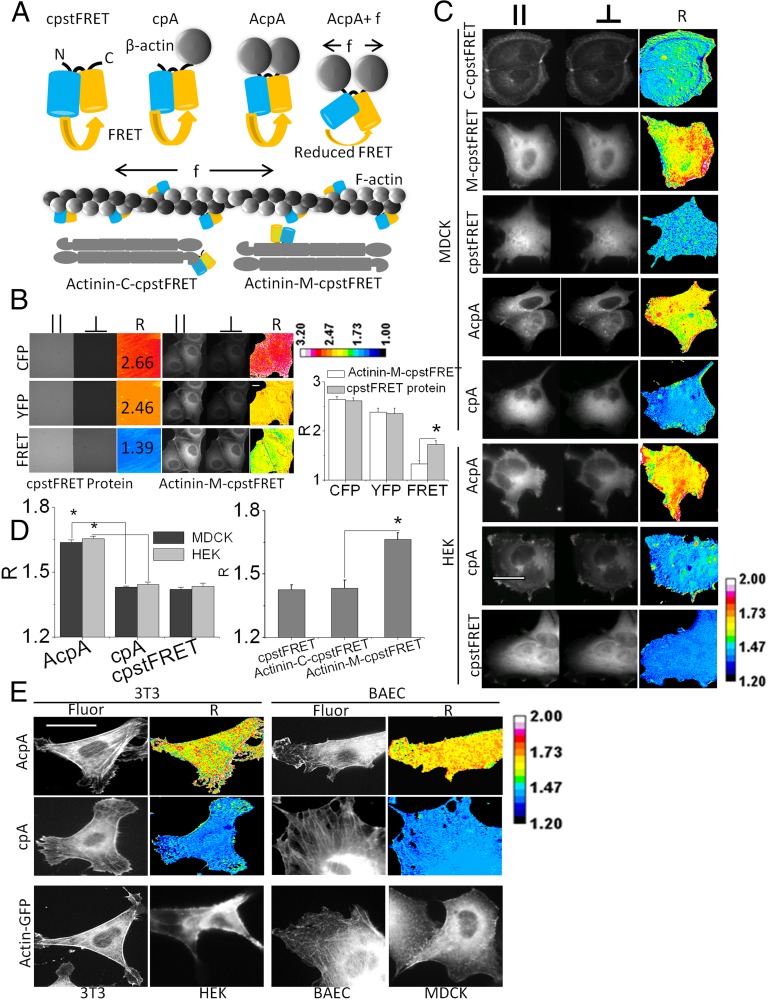
Fig. 2.
Actin–cpstFRET–Actin and actinin–M–cpstFRET report force in actin and the actin cross-linker actinin. (A) Schematic diagram of actin–cpstFRET and actinin–cpstFRET chimeric constructs. cpA, cpstFRET–β-actin with one actin molecule attached to the C-terminal of cpstFRET; AcpA, Actin–cpstFRET–Actin with one actin molecule attached on each end of cpstFRET. f indicates force, which expands the structure of cpstFRET and leads to a reduction of FRET. The f-actin cartoon only presents what we expect to be the dominant configuration of probe incorporation and does not intend to exclude incorporation into cross-links. Actinin–C–cpstFRET/C–cpstFRET represents C-terminal–tagged actinin (force-free); Actinin–M–cpstFRET/M–cpstFRET represents actinin with the sensor incorporated in the middle of the host. (B) Comparison of the anisotropy ratio R of purified cpstFRET protein in solution and in the actinin host in MDCK cells. R is calculated from parallel and perpendicular polarizations using the equations shown in Fig. 1. The R images are presented in a 16-pseudocolor map with a range from 1.0 to 3.2. (Scale bar, 20 μm.) Histograms show R from cpstFRET protein and actinin–M–cpstFRET, n ≥ 3. P < 0.05 by Student t test. (C) cpstFRET reporting constitutive tension in actin and actinin in HEK and MDCK cells. MDCK cells expressed Actinin–M–cpstFRET, Actinin–C–cpstFRET, cpstFRET, AcpA, and cpA. HEK expressed cpstFRET, AcpA, and cpA. High R means high stress and vice versa. (D) Histogram plot of R for HEK and MDCK cells. P < 0.05 by Student t test. (E) 3T3 and BAEC cell expressing force-free cpA or AcpA and HEK, MDCK, 3T3, and BAEC expressing Actin–GFP. Fluor, YFP fluorescence channel acquired from acceptor Venus R ratio image indicates force levels. R images are presented in ImageJ 16-pseudocolor map with a range of 1.2–2.0. (Scale bar, 20 μm.)

