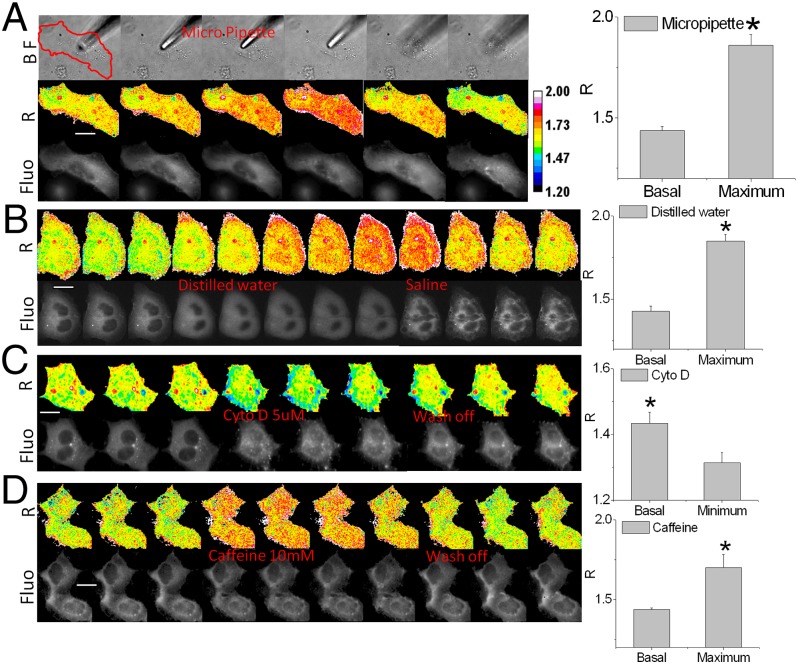
Fig. 3.
cpstFRET reports changes in actin force in response to mechanical and chemical stimuli. (A) MDCK cells expressing AcpA were indented by a micropipette; the red line outlines the cell. Fluo, FRET image of the cell; R, anisotropy ratio images showing force in actin. (The experiments were repeated n ≥ 5.) Histograms show maximum changes in the ratio R (P < 0.05 by Student t test). (B) MDCK cells challenged by anisotonic osmotic pressure. Replacing Hepes buffer with distilled water swelled the cells and increased force in actin, and returning them to saline shrank the swollen cells and lowered stress below resting levels in places (green). (C) HEK AcpA cells treated with 5 μM of cytochalasin D. (D) HEK AcpA cells treated with 10 mM of caffeine to elevate calcium Ca+2 and induce contraction. Each experiment was repeated n ≥ 5. Histograms on the right show the maximum ratio R changes under each condition. P < 0.05 by Student's t test, calibration bar with 16-color map. (Scale bar, 20 μm.)

