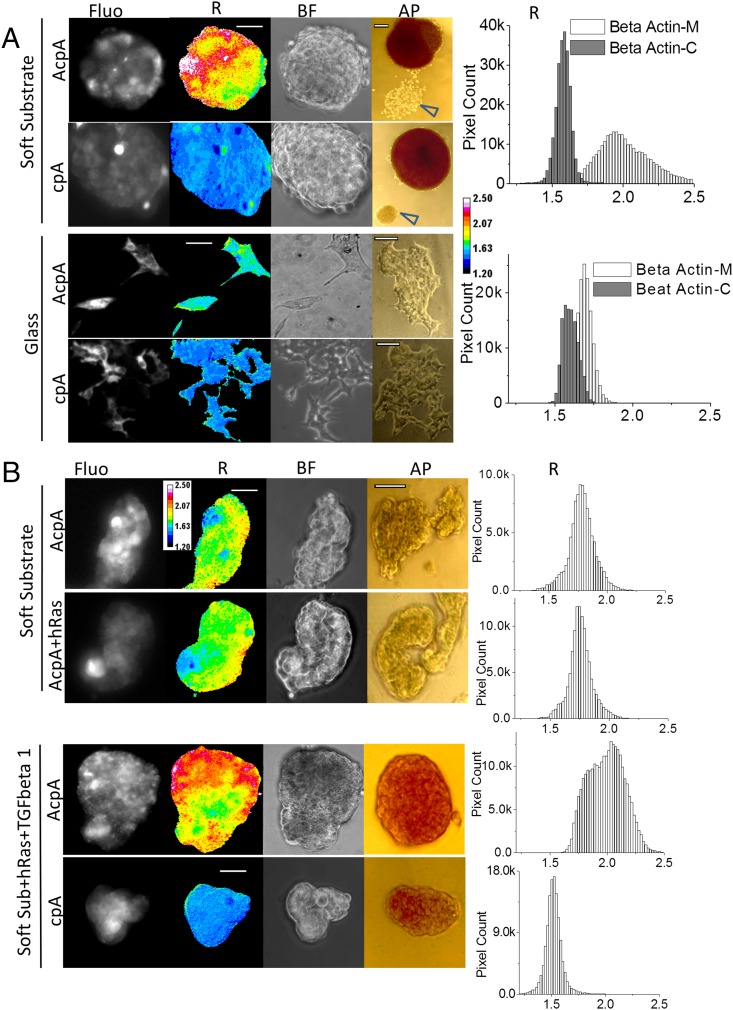
Fig. 5.
Actin force elevation in stem-like cells reprogrammed from HEK and MDCK stable cell lines. (A) HEK actin stable cell lines cultured on soft substrate (PDMS) and glass. AcpA, HEK stable line expressing actin–cpstFRET–actin; AP, alkaline phosphatase staining of EBs and cells; BF, bright-field images of EBs and cells; cpA, HEK stable line expressing cpstFRET–actin; Fluo, FRET signal; R, anisotropy ratio representing tension in actin. Arrowheads indicate HEK cells attached to the substrate showing no AP activity, and these cells were not reprogrammed. Pixel count distribution plots on the right were generated from all pixels from >10 R images. R images are presented with a 16-color map of 1.20–2.50. (Scale bar, 50 μm.) (AP scale bar, 100 μm.) (B) MDCK actin stable cell lines cultured on soft substrate (PDMS). AcpA, MDCK stable line expressing actin–cpstFRET–actin cassette; cpA, MDCK stable line expressing cpstFRET–actin; +hRas, MDCK stable cell lines expressing hRas gene; +TGFbeta 1, cell cultures were supplied with 5 μg/mL TGF-β1. hRas MDCK stable lines were derived from MDCK AcpA or cpA stable cell lines. Pixel count distribution plots on the right were created using all pixel values from at least 10 R images. R images are presented with a 16-color map of Image J with a range of 1.20–2.50. (Scale bar, 50 μm.) (AP scale bar, 100 μm.)

