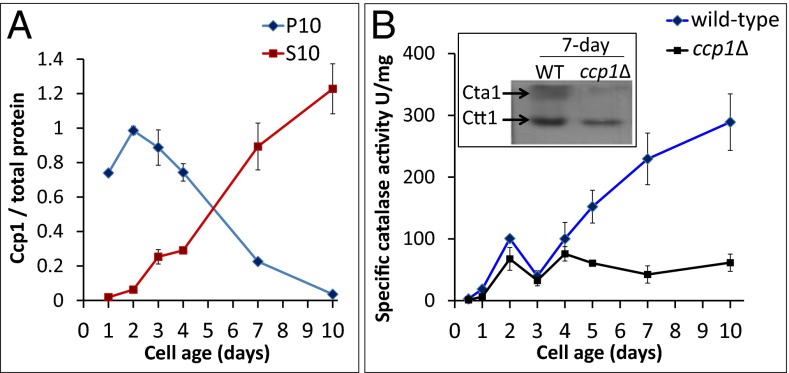
Fig. 3.
Catalase activity in wild-type yeast increases at the expense of mitochondrial Ccp1. (A) Ccp1 protein level vs. cell age in the S10 and P10 fractions from Fig. 2B. (B) Specific catalase activity in soluble protein extracts from wild-type and ccp1∆ cells vs. cell age. Results are averages of three independent cultures (n = 3) ± SD. (Inset) In-gel assay of Cta1 and Ctt1 catalase activities in 7-d soluble protein extracts (2.5 μg protein per lane).

