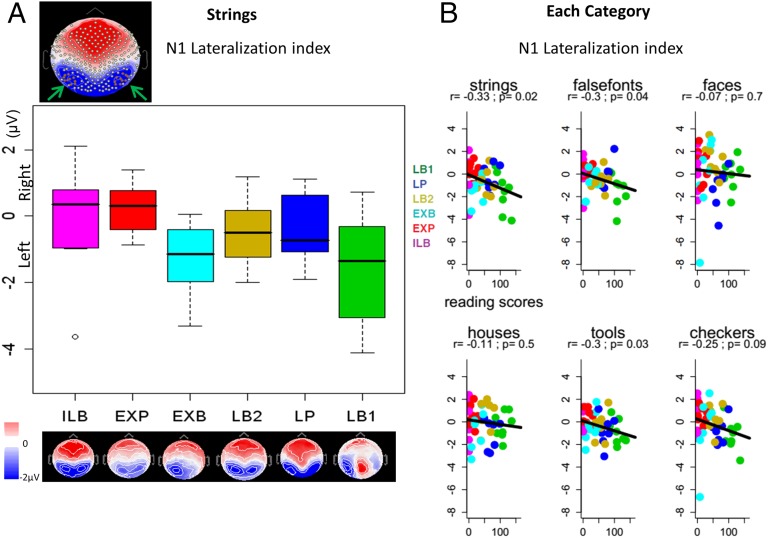
Fig. 3.
Impact of reading ability on the lateralization of N1. (A) Scalp map of the N1 topography at 176 ms after the stimulus in the grand average (all subjects and conditions collapsed). Arrows indicate the symmetric occipitotemporal clusters selected (10 eletrodes for each hemisphere; in red). The boxplots represent the voltages from these two clusters on the left hemisphere minus those from the right hemisphere, calculated for each subject from the activation evoked by letter strings, across a 40-ms window centered on the N1 peak (i.e., left lateralization index of N1). Scalp maps on the N1 peak are plotted for each of the six subgroups of participants with increasing levels of reading ability, from illiterates (ILB) on the left to ex-illiterates (EXP and EXB) in the middle to literates (LB2, LP, and LB1) on the right. (B) Correlation of the N1 lateralization index with the participant’s reading scores for each category.

