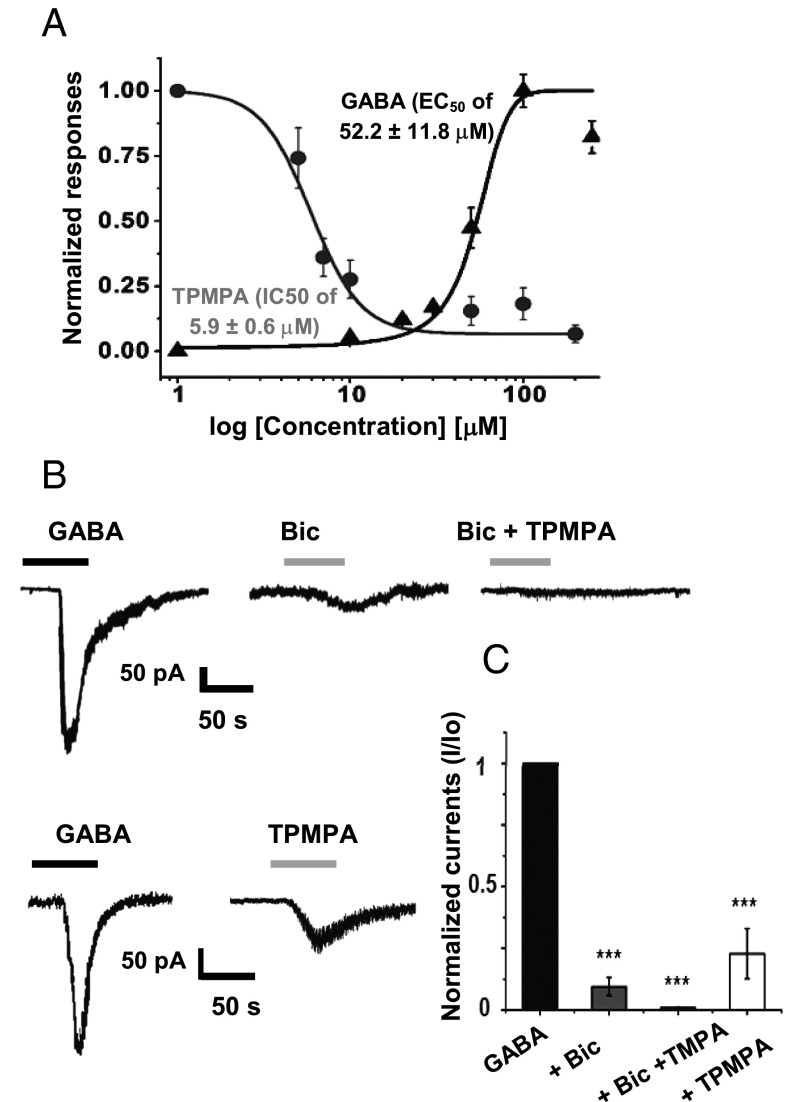
Fig. 2.
GABA responses of cerebellar astrocytes in culture. (A) GABA and TPMPA dose–response curves (n = 6). (B) GABA responses (from left to right): Bicuculline 100 μM inhibited the GABA response (90.5 ± 3.7%), bicuculline 100 μM plus TPMPA 10 μM blocked 100% of the GABA response (n = 6), and TPMPA 10 μM inhibited the GABA response (81.1 ± 5.9%) (n = 6). (C) Dose–response relationship for GABA and TPMPA blockage. Quantitation of inhibition of GABA responses by bicuculline and GABA was significant. ***P < 0.001, one-way ANOVA.

