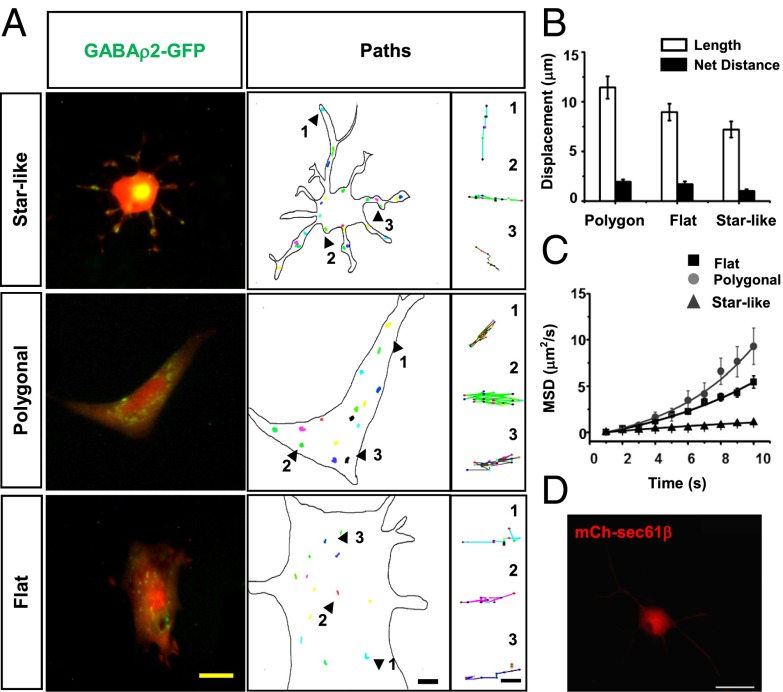
Fig. 5.
Distribution and trafficking of GABAρ2-GFP. (A) Left to right columns: Fluorescence emitted by GABAρ2–GFP (green) and soluble mCherry (red). GABAρ2-GFP accumulates in clusters located in the soma and along the processes. Arrowheads and numbers indicate samples of isolated tracked paths of GABAρ2-GFP. (Scale bars: 25, 5, and 1 μm, respectively.) (B) Displacement length and net distance traveled of GABAρ2-GFP did not differ significantly among astrocytes with different phenotypes. (C) MSD curves of GABAρ2-GFP fluorescent clusters. Exponential correlation indicates directional movements in soma and processes of flat and polygonal cells, and linear correlation is evidence of simple diffusion in star-like cells (510 clusters from 40 cells). (D) Distribution of mCh-Sec61β in soma and distal processes. (Scale bar: 20 μm.)

